. 2003 Apr;23(8):2709-19.
doi: 10.1128/MCB.23.8.2709-2719.2003.

Endogenous assays of DNA methyltransferases: Evidence for differential activities of DNMT1, DNMT2, and DNMT3 in mammalian cells in vivo

Affiliations

Endogenous assays of DNA methyltransferases: Evidence for differential activities of DNMT1, DNMT2, and DNMT3 in mammalian cells in vivo

Kui Liu et al. Mol Cell Biol. 2003 Apr.

Abstract

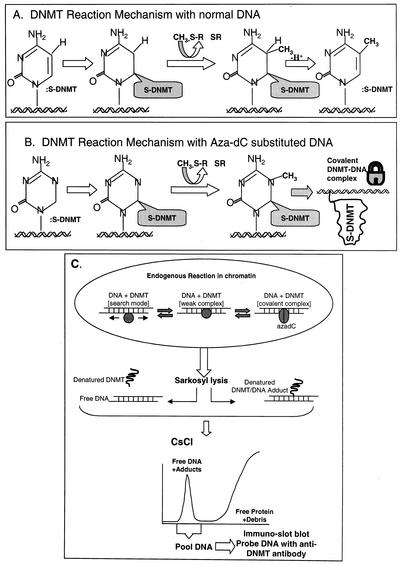
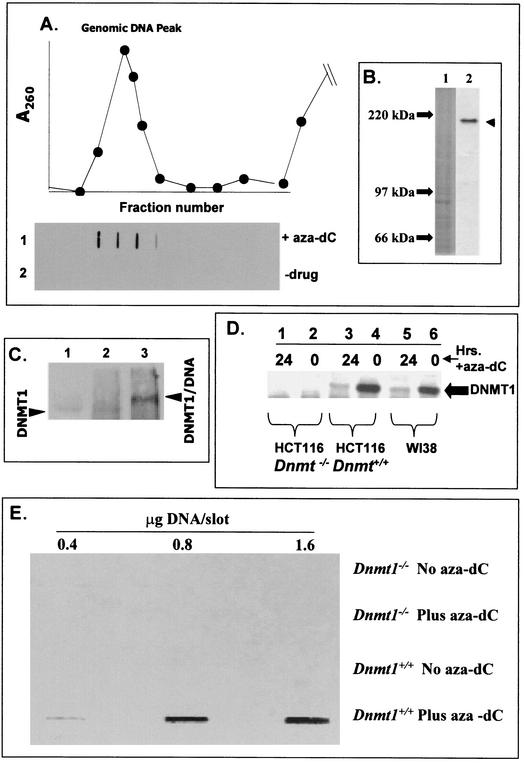
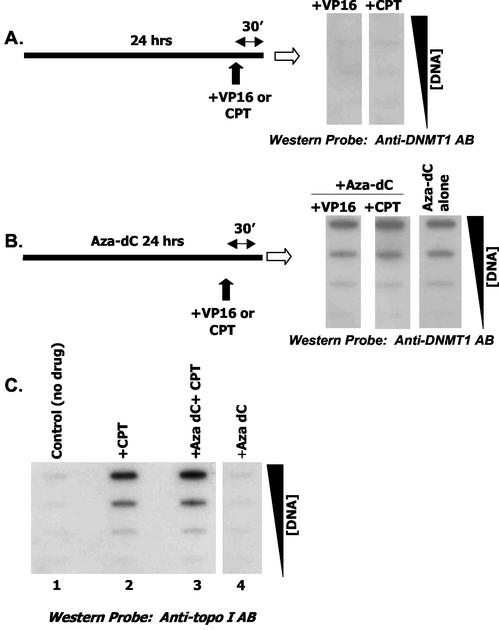
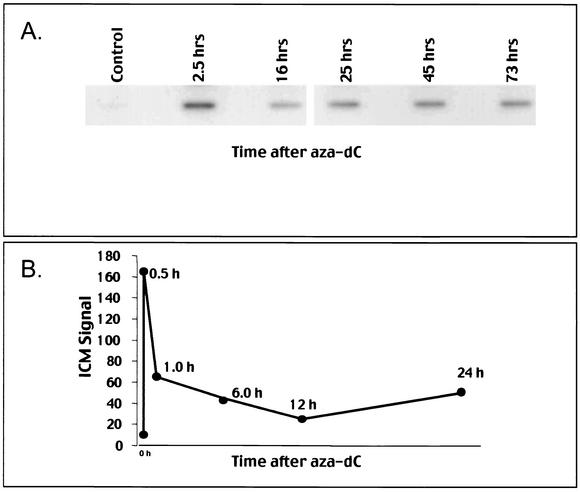
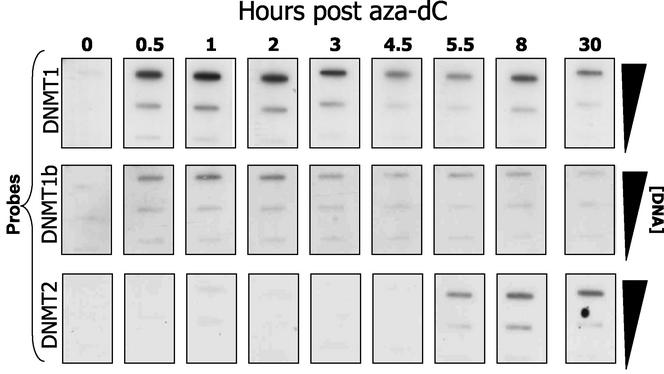
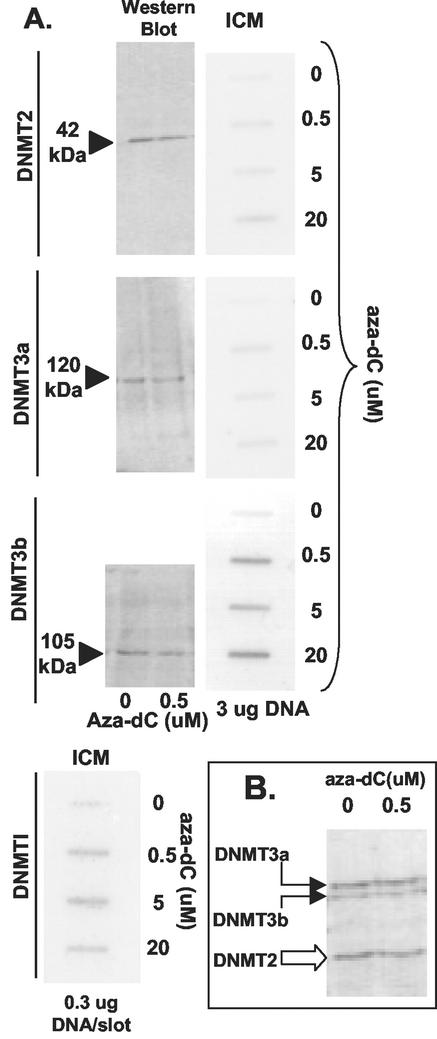
While CpG methylation can be readily analyzed at the DNA sequence level in wild-type and mutant cells, the actual DNA (cytosine-5) methyltransferases (DNMTs) responsible for in vivo methylation on genomic DNA are less tractable. We used an antibody-based method to identify specific endogenous DNMTs (DNMT1, DNMT1b, DNMT2, DNMT3a, and DNMT3b) that stably and selectively bind to genomic DNA containing 5-aza-2'-deoxycytidine (aza-dC) in vivo. Selective binding to aza-dC-containing DNA suggests that the engaged DNMT is catalytically active in the cell. DNMT1b is a splice variant of the predominant maintenance activity DNMT1, while DNMT2 is a well-conserved protein with homologs in plants, yeast, Drosophila, humans, and mice. Despite the presence of motifs essential for transmethylation activity, catalytic activity of DNMT2 has never been reported. The data here suggest that DNMT2 is active in vivo when the endogenous genome is the target, both in human and mouse cell lines. We quantified relative global genomic activity of DNMT1, -2, -3a, and -3b in a mouse teratocarcinoma cell line. DNMT1 and -3b displayed the greatest in vivo binding avidity for aza-dC-containing genomic DNA in these cells. This study demonstrates that individual DNMTs can be tracked and that their binding to genomic DNA can be quantified in mammalian cells in vivo. The different DNMTs display a wide spectrum of genomic DNA-directed activity. The use of an antibody-based tracking method will allow specific DNMTs and their DNA targets to be recovered and analyzed in a physiological setting in chromatin.


Figures

FIG. 1.
FIG. 1.
DNMT reaction mechanism and the ICM assay. (A) Methylation on non-aza-dC-containing DNA proceeds via a nucleophilic attack by cysteine thiolate of DNMT at the C-6 on cytosine followed by a second nucleophilic attack at C-5 by the methyl group of S-adenosylmethionine (methyl donor). This results in the transfer of the methyl group to C-5 and an intermediate that is resolved by β elimination of DNMT at C-6 and abstraction of a proton from C-5. (B) Mechanism of action on aza-dC-substituted DNA involves a methyl transfer at the N-5 of aza-dC and formation of a stable or covalent complex between enzyme and DNA that is resistant to ionic detergents, high ionic strength, and temperature (viz., conditions that dissociate proteins that are noncovalently bound to DNA) (9, 10, 15, 34). (C) Overview of the ICM assay. The endogenous DNMT reaction in vivo shows the enzyme in either a one-dimensional search mode (scanning for suitable CpG targets in chromatin) in a weak binding mode (enzyme paused over a chromatin-accessible CpG site in vivo) or in the covalent DNMT-DNA complex mode with aza-dC-substituted DNA. Direct addition of Sarkosyl lyses the cells and disrupts weak (noncovalent) protein-DNA complexes in chromatin; however, aza-dC-induced DNMT-DNA complexes are not dissociable under these conditions. The viscous lysate is sheared and overlaid onto a step CsCl gradient (Materials and Methods) that resolves DNA from the bulk, excess free protein and debris in a single step (35, 38, 39). Proteins stably bound to the DNA are dragged down to the 1.7-g/ml fraction of the gradient. The DNA fraction contains DNMTs only when the cells have been prelabeled with aza-dC. Specific DNMTs are quantified in the DNA peak by Western slot blotting. Note that the material at the top of the gradient gives a nonspecific Western blot signal due to the excess of membranous debris and cannot be relied on to measure free DNMT. To demonstrate that the DNA peak-associated DNMT signal is real (and not carryover from the top of the gradient), the DNA peak can be collected and rebanded in CsCl to give quantitative recovery of the DNMT signal in a second gradient (data not shown). The ICM data were not affected by digestion of lysates with RNase A prior to centrifugation; therefore, RNase digestion was deemed unnecessary.
FIG. 2.
FIG. 2.
ICM and band depletion analysis of Dnmt1−/− and Dnmt1+/+ HCT-116 colon cancer cells with and without aza-dC. (A) ICM assay results with HeLa cells. Approximately 3 × 10⁷ HeLa cells in exponential growth were untreated or treated with 5 μM aza-dC for 24 h; following Sarkosyl lysis, the DNA was banded in CsCl, the gradient was fractionated, and the DNA peak was located by UV absorbance. Individual fractions were slot blotted onto membranes and probed with anti-DNMT1 antibody as described in Materials and Methods. Each slot corresponds to the gradient fraction shown in the graph (top fractions of gradient not shown). (B) Western blotting of DNMT1 in HeLa cell extracts. Nuclear extracts (100 μg) were subjected to SDS-polyacrylamide gel electrophoresis, and the Western blots were probed with anti-DNMT1 antibody as described in Materials and Methods. Lane 1, stained gel (molecular weight markers indicated); and lane 2, autoradiogram. (C) Electrophoretic mobility shifts. HeLa cells were treated with aza-dC exactly as described for panel A and were subjected to ICM. The DNA was recovered and dialyzedagainst TNM (10 mM Tris-HCl, pH 8.0, 1 mM EDTA, and 10 mM MgCl2), and aliquots were removed for digestion with 50 μg of DNase I/ml (60 min at 37°C). DNA was immunoprecipitated with anti-DNMT1 antibody and was analyzed by SDS-polyacrylamide gel electrophoresis followed by Western blotting (probed with anti-DNMT1 antibody). Lane 1, HeLa nuclear extract control showing the position of DNMT1 polypeptide from non-drug-treated cells. Lane 2, anti-DNMT1 immunoprecipitated DNA (from CsCl gradient) before DNase I digestion. Lane 3, same as lane 2, after DNase I digestion. (D) Band depletion analysis of DNMT1 in Dnmt1+/+ and Dnmt1−/− HCT-116 and WI-38 cell lines. Cells (107/dish) were exponentially growing when treated (or not as indicated on the top of the blot) with 5 μM aza-dC for 12 h at 37°C in tissue culture medium plus 10% bovine calf serum. Nuclear proteins were extracted for SDS-polyacrylamide gel electrophoresis and Western blotting as described in Materials and Methods by using anti-DNMT1 antibody probe. The large filled arrow marks the position of the DNMT1 polypeptide band. (E) ICM analysis of DNMT1 in HCT-116 Dnmt1+/+ and Dnmt1−/− cells. Cells were treated with aza-dC or untreated as described for panel D above and were subjected to the ICM analysis. The DNA peak was pooled, and its concentration was measured. Either 0.4, 0.8, or 1.6 μg of DNA was slot blotted onto a membrane, which was probed with DNMT1 antibody.
FIG. 3.
FIG. 3.
Combined effects of topo I and II trapping on DNMT1 adduct formation. HeLa cells (exponentially growing; 4 × 10⁷ cells/ICM) were cultured for 24 h without or with aza-dC (5 μM), followed by 30 min of exposure to VP16 (10 μM) or CPT (50 μM) as indicated and subjected to the ICM assay. Increasing amounts of DNA (from 1 to 10 μg) were spotted on the membrane. (A) Two cultures were treated with either VP16 or CPT and probed with anti-DNMT1 antibody. (B) Three plates were treated with aza-dC alone or with aza-dC/VP16 and aza-dC/CPT as indicated. Increasing amounts of DNA were spotted and probed with anti-DNMT1 antibody. Panel C shows several controls where the blot was probed with anti-topo I antibody.
FIG. 4.
FIG. 4.
ICM time course and aza-dC dose response in different cell lines. (A and B) Time course of DNMT1 adduct formation. HeLa cells (A) or Jurkat cells (B) in exponential growth were treated with 5 μM aza-dC or untreated. Panel A shows the ICM slot blot for a single DNA concentration of 3 μg. Panel B shows the digitized data where the ICM signal was arbitrarily assigned unit values based upon phosphorimaging of a single DNA concentration on the ICM slot blot.
FIG. 5.
FIG. 5.
Comparative analysis of DNMT1, DNMT1b, and DNMT2 in HeLa cells. HeLa cells in exponential growth (4 × 10⁷/ICM assay) were treated with 5 μM aza-dC for the times indicated (“0” corresponds to a negative control) and were subjected to the ICM analysis by using two different probes: anti-DNMT1 (top row) and anti-DNMT1b (middle row) and anti-DNMT2 antibody (bottom). The amount (in micrograms) of DNA loaded per slot is indicated on the right side of the blot.
FIG. 6.
FIG. 6.
Comparing endogenous DNMTs in mouse cells. (A) P19 cell cultures in exponential growth (4 × 10⁷/dish) were treated with 0, 0.5, 5, or 20 μM aza-dC for 8 h. Half of the cultures were subjected to the ICM analysis (slot blots labeled ICM on top) by using anti-DNMT probes indicated on the left. Nuclear extracts were prepared (from duplicate cultures) and were analyzed by SDS-polyacrylamide gel electrophoresis and Western blotting by using the probes shown on the left. For the Western blots (150 μg of protein per lane) only the 0 and 0.5 μM aza-dC samples are shown. For the ICM analysis, all concentrations of aza-dC titration are shown, with use of a fixed amount of DNA in each slot (3 or 0.3 μg as indicated). (B) An admixture of antibodies was used for two P19 nuclear extracts (150 μg/lane) prepared from cells treated with 0 or 0.5 μM aza-dC (8 h).

Similar articles

Cited by

References

    1. Aoki, A., I. Suetake, J. Miyagawa, T. Fujio, T. Chijiwa, H. Sasaki, and S. Tajima. 2001. Enzymatic properties of de novo type mouse DNA (cytosine-5) methyltransferases. Nucleic Acids Res. 29:3506-3512. - PMC - PubMed
    1. Baylin, S. B., M. Esteller, M. R. Rountree, K. E. Bachman, K. Schuebel and J. G. Herman. 2001. Aberrant patterns of DNA methylation, chromatin formation and gene expression in cancer. Hum. Mol. Genet. 10:687-692. - PubMed
    1. Belinsky, S. A., K. J. Nikula, W. A. Palmisano, R. Michels, G. Saccomanno, E. Gabrielson, S. B. Baylin, and J. G. Herman. 1998. Aberrant methylation of p16INK4a is an early event in lung cancer and a potential biomarker for early diagnosis. Proc. Natl. Acad. Sci. USA 95:11891-11896. - PMC - PubMed
    1. Bestor, T. 2000. The DNA methyltransferases of mammals. Hum. Mol. Genet. 9:2395-2402. - PubMed
    1. Bonfils, C., N. Beaulieu, E. Chan, J. Cotton-Montpetit, and A. R. MacLeod. 2000. Characterization of the human DNA methyltransferase splice variant Dnmt1b. J. Biol. Chem. 275:10754-10760. - PubMed

LinkOut - more resources