

Short telomeres induce a DNA damage response in Saccharomyces cerevisiae
- PMID: 12631718
- PMCID: PMC151574
- DOI: 10.1091/mbc.02-04-0057
Short telomeres induce a DNA damage response in Saccharomyces cerevisiae
Abstract
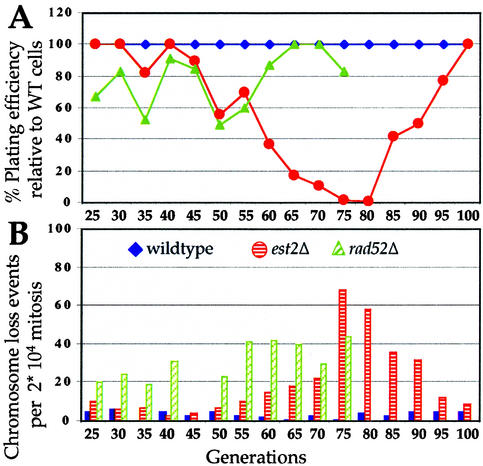
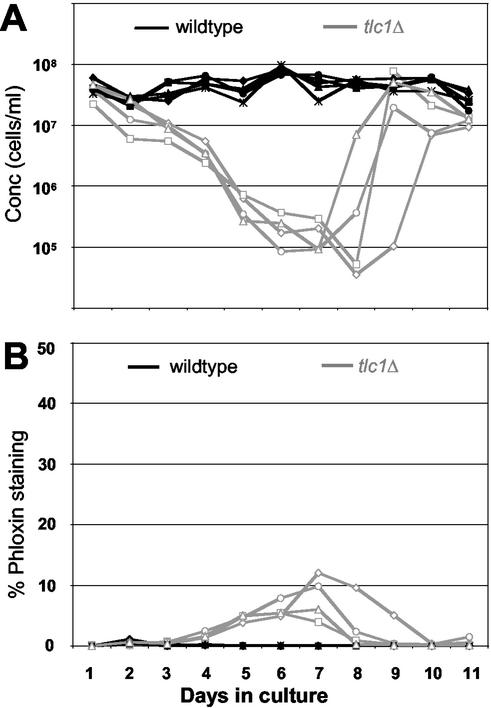
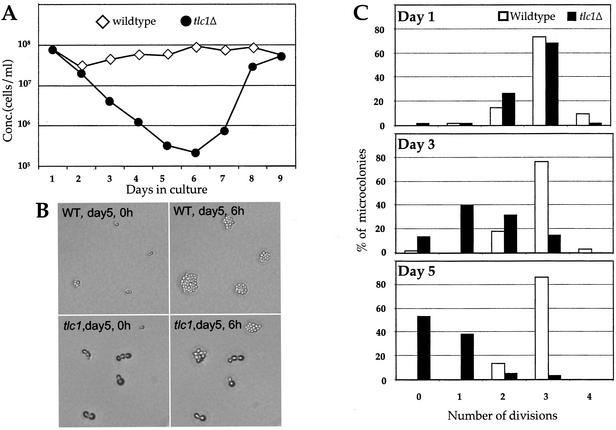
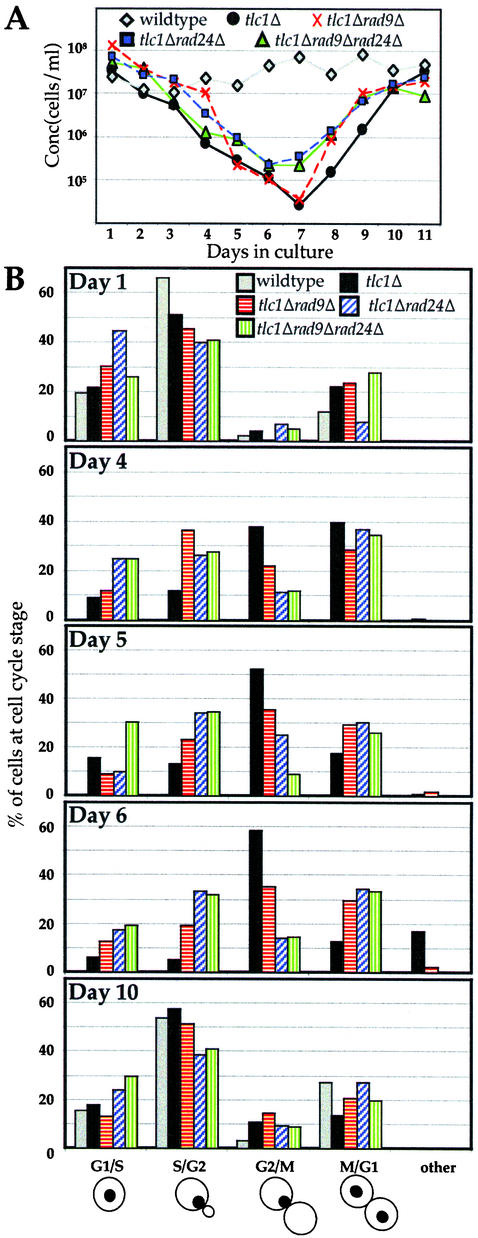
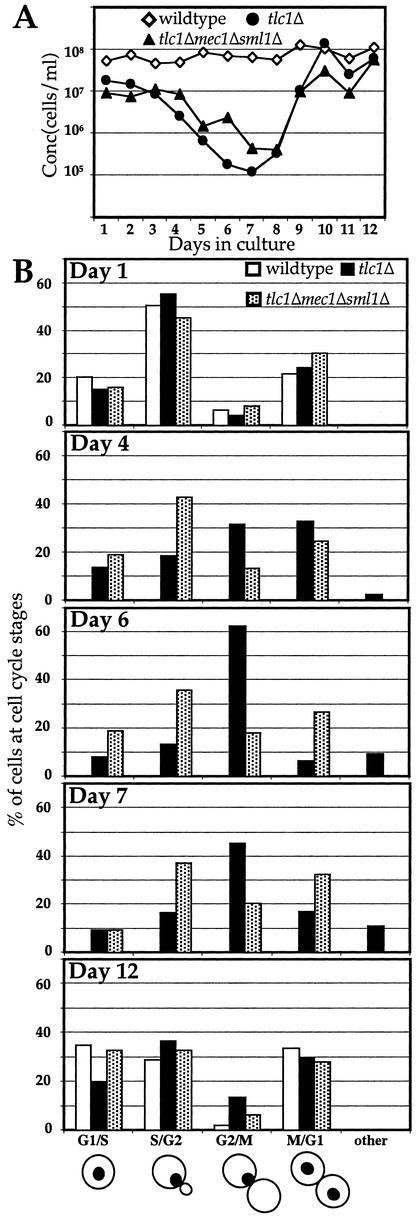
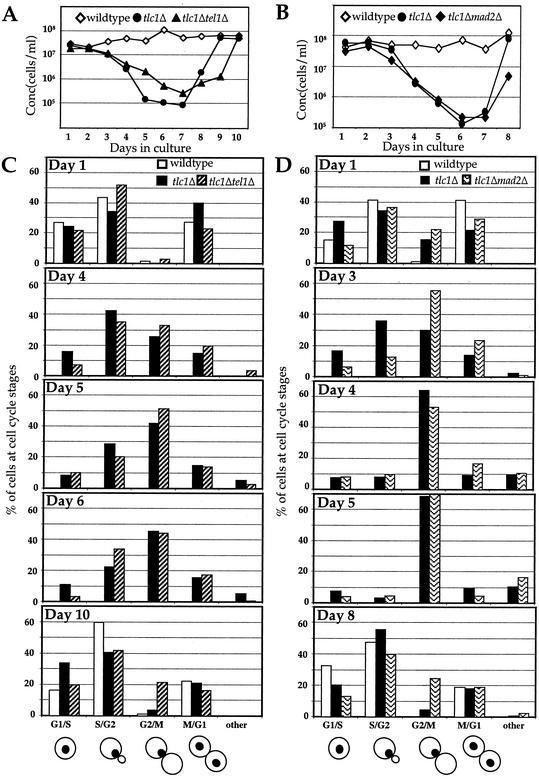
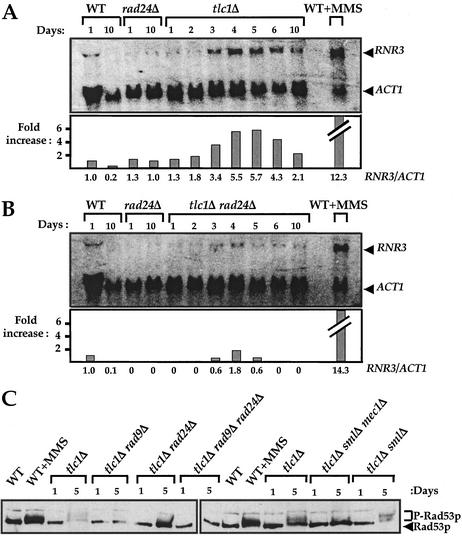
Telomerase-deficient Saccharomyces cerevisiae cells show a progressive decrease in telomere length. When grown for several days in log phase, the tlc1Delta cells initially display wild-type growth kinetics with subsequent loss of growth potential after which survivors are generated via RAD52-dependent homologous recombination. We found that chromosome loss in these telomerase-deficient cells only increased after a significant decline in growth potential of the culture. At earlier stages of growth, as the telomerase-deficient cells began to show loss of growth potential, the cells arrested in G2/M and showed RNR3 induction and Rad53p phosphorylation. These responses were dependent on RAD24 and MEC1, suggesting that short telomeres are recognized as DNA damage and signal G2/M arrest.
Figures

Similar articles
-
MEC3, MEC1, and DDC2 are essential components of a telomere checkpoint pathway required for cell cycle arrest during senescence in Saccharomyces cerevisiae.Mol Biol Cell. 2002 Aug;13(8):2626-38. doi: 10.1091/mbc.02-02-0012. Mol Biol Cell. 2002. PMID: 12181334 Free PMC article.
-
Control of the yeast telomeric senescence survival pathways of recombination by the Mec1 and Mec3 DNA damage sensors and RPA.Nucleic Acids Res. 2007;35(3):822-38. doi: 10.1093/nar/gkl1081. Epub 2007 Jan 3. Nucleic Acids Res. 2007. PMID: 17202155 Free PMC article.
-
S. cerevisiae Tel1p and Mre11p are required for normal levels of Est1p and Est2p telomere association.Mol Cell. 2006 Nov 17;24(4):603-10. doi: 10.1016/j.molcel.2006.10.005. Mol Cell. 2006. PMID: 17188035
-
Telomere length homeostasis.Chromosoma. 2006 Dec;115(6):413-25. doi: 10.1007/s00412-006-0067-3. Epub 2006 Jun 2. Chromosoma. 2006. PMID: 16741708 Review.
-
Telomere length regulation: coupling DNA end processing to feedback regulation of telomerase.EMBO J. 2009 Aug 19;28(16):2309-22. doi: 10.1038/emboj.2009.195. Epub 2009 Jul 23. EMBO J. 2009. PMID: 19629031 Free PMC article. Review.
Cited by
-
Alternative Lengthening of Telomeres in Yeast: Old Questions and New Approaches.Biomolecules. 2024 Jan 16;14(1):113. doi: 10.3390/biom14010113. Biomolecules. 2024. PMID: 38254712 Free PMC article. Review.
-
Checkpoint-dependent phosphorylation of Exo1 modulates the DNA damage response.EMBO J. 2008 Sep 17;27(18):2400-10. doi: 10.1038/emboj.2008.171. Epub 2008 Aug 28. EMBO J. 2008. PMID: 18756267 Free PMC article.
-
Happily (n)ever after: Aging in the context of oxidative stress, proteostasis loss and cellular senescence.Redox Biol. 2017 Apr;11:482-501. doi: 10.1016/j.redox.2016.12.001. Epub 2016 Dec 7. Redox Biol. 2017. PMID: 28086196 Free PMC article. Review.
-
Short and dysfunctional telomeres sensitize the kidneys to develop fibrosis.Nat Aging. 2021 Mar;1(3):269-283. doi: 10.1038/s43587-021-00040-8. Epub 2021 Mar 15. Nat Aging. 2021. PMID: 37118410
-
Telomere shortening triggers a feedback loop to enhance end protection.Nucleic Acids Res. 2017 Aug 21;45(14):8314-8328. doi: 10.1093/nar/gkx503. Nucleic Acids Res. 2017. PMID: 28575419 Free PMC article.
References
-
- Allen JB, Zhou Z, Siede W, Friedberg EC, Elledge SJ. The SAD1/RAD53 protein kinase controls multiple checkpoints and DNA damage-induced transcription in yeast. Genes Dev. 1994;8:2401–2415. - PubMed
-
- Blasco MA, Lee H-W, Hande PM, Samper E, Lansdorp PM, DePinho RA, Greider CW. Telomere shortening and tumor formation by mouse cells lacking telomerase RNA. Cell. 1997;91:25–34. - PubMed
-
- Brachmann CB, Davies A, Cost GJ, Caputo E, Li J, Hieter P, Boeke JD. Designer deletion strains derived from Saccharomyces cerevisiae S288C: a useful set of strains and plasmids for PCR-mediated gene disruption and other applications. Yeast. 1998;14:115–132. - PubMed
-
- Chan SW, Chang J, Prescott J, Blackburn EH. Altering telomere structure allows telomerase to act in yeast lacking ATM kinases. Curr Biol. 2001;11:1240–1250. - PubMed
-
- Charles JF, Jaspersen SL, Tinker-Kulberg RL, Hwang L, Szidon A, Morgan DO. The Polo-related kinase Cdc5 activates and is destroyed by the mitotic cyclin destruction machinery in S. cerevisiae. Curr Biol. 1998;8:497–507. - PubMed
Publication types
MeSH terms
Substances
Grants and funding
LinkOut - more resources
Full Text Sources
Other Literature Sources
Molecular Biology Databases
Research Materials
