. 2003 Mar 1;23(5):1769-80.
doi: 10.1523/JNEUROSCI.23-05-01769.2003.

Widespread defects in the primary olfactory pathway caused by loss of Mash1 function

Affiliations

Widespread defects in the primary olfactory pathway caused by loss of Mash1 function

Richard C Murray et al. J Neurosci. .

Abstract

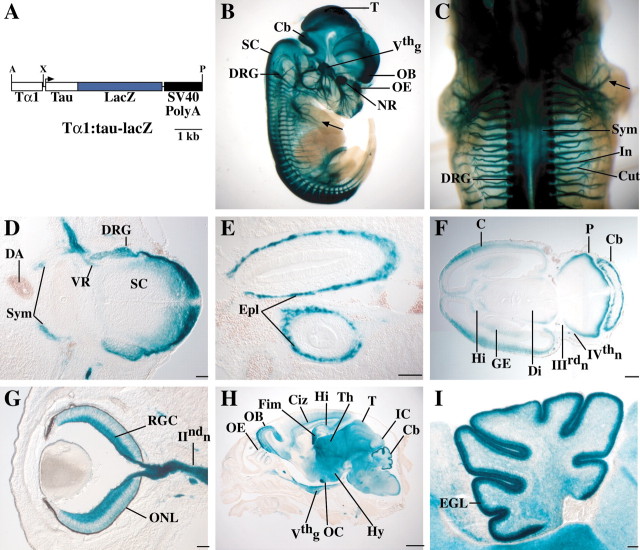
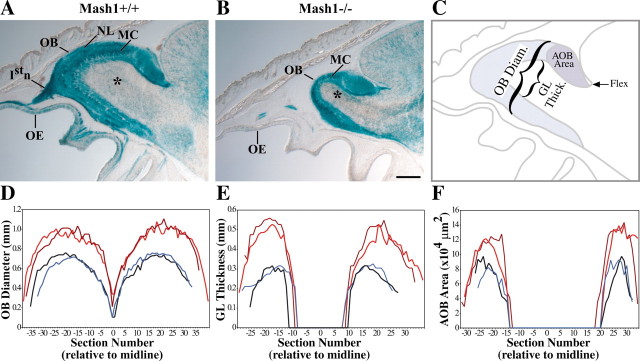
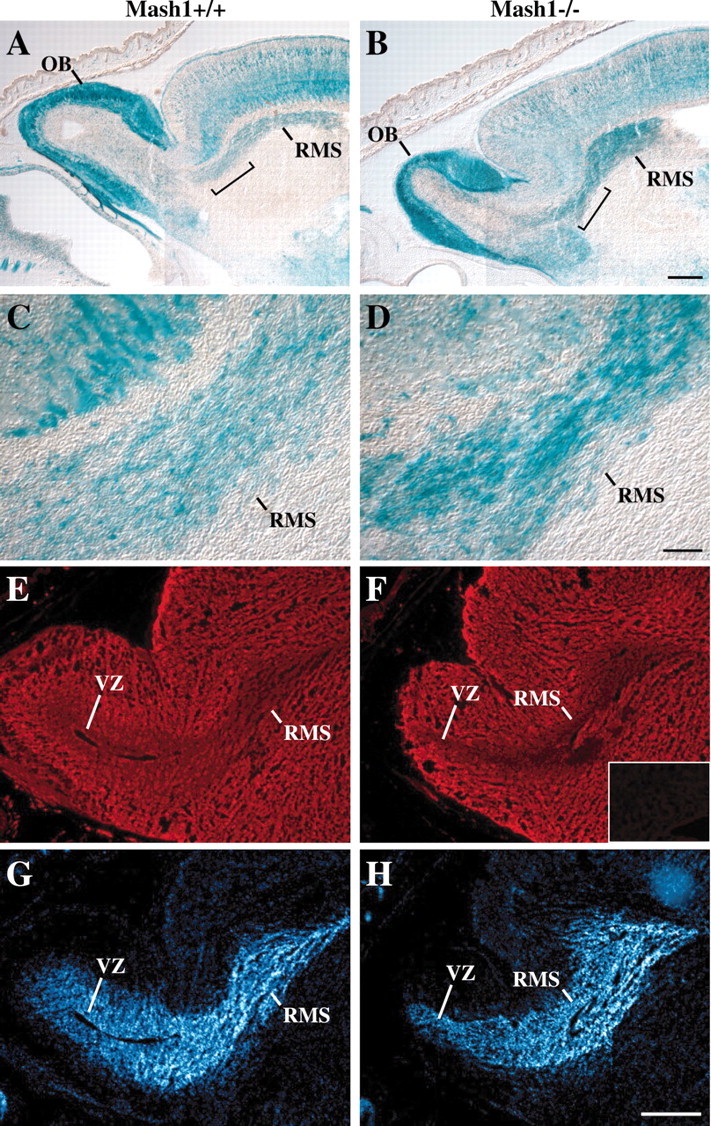
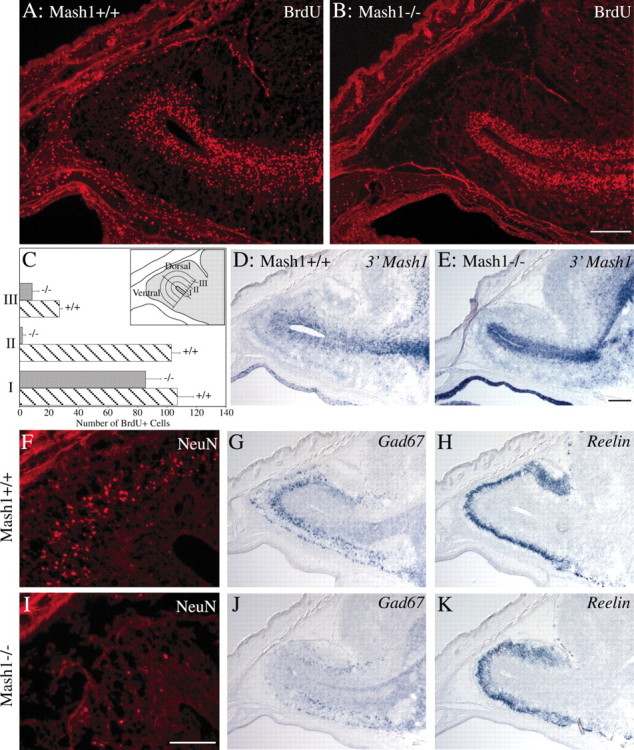
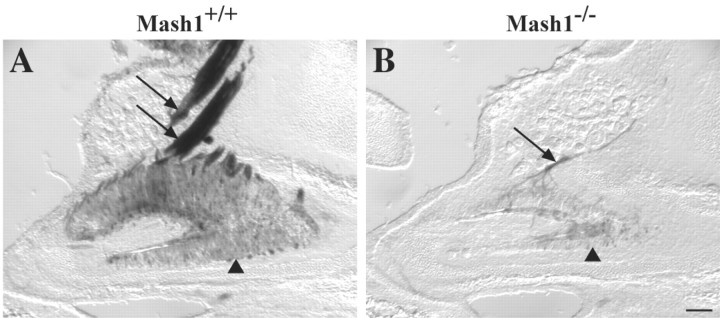
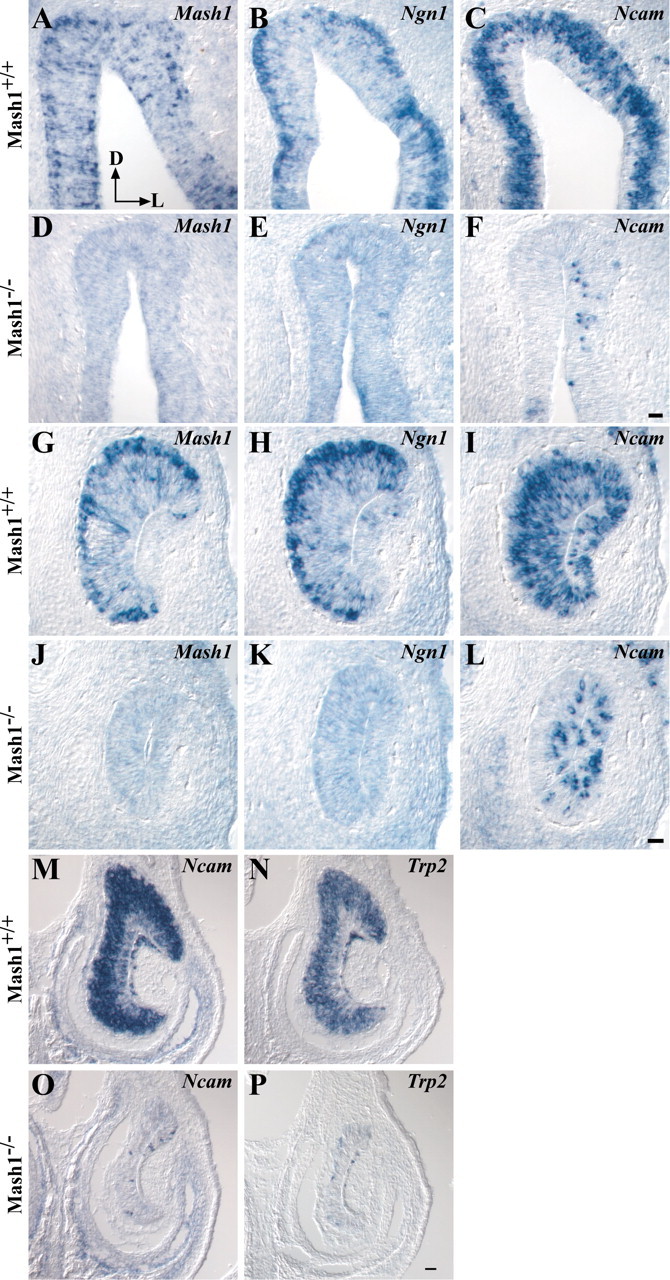
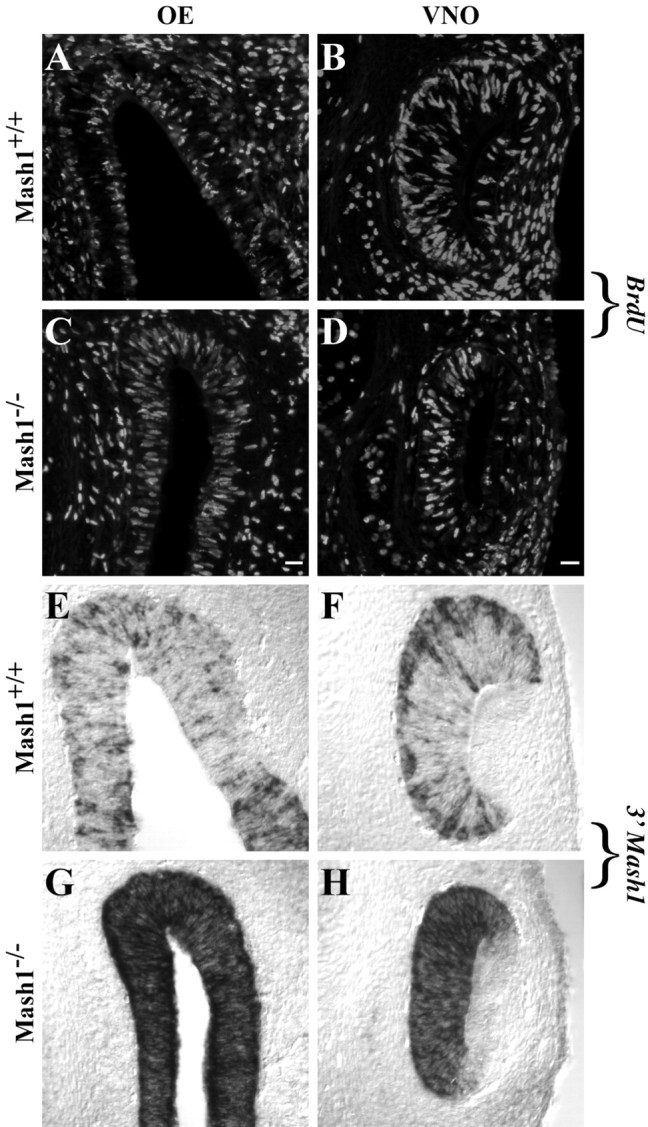
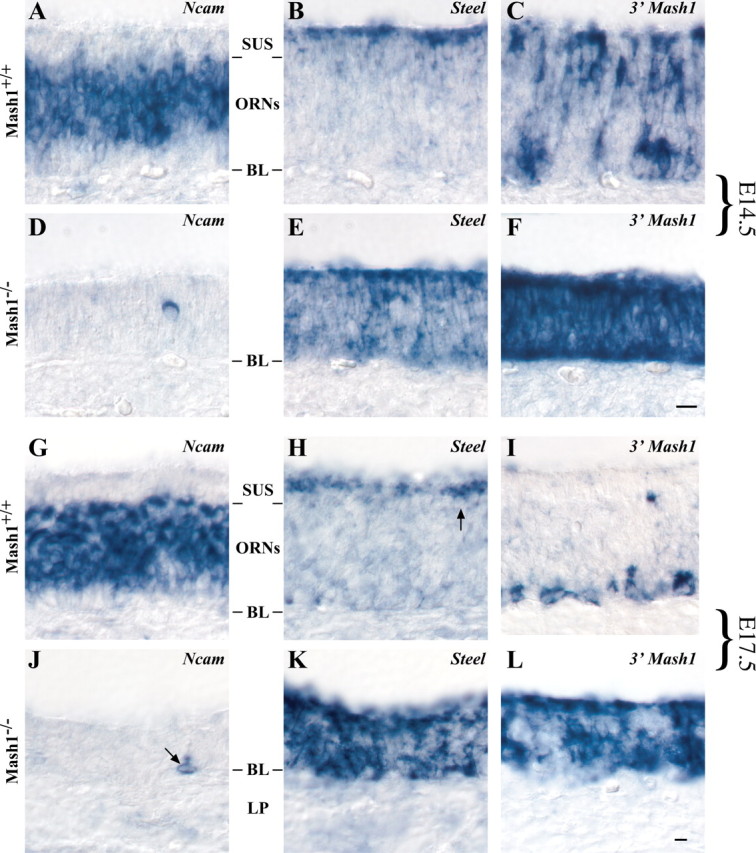
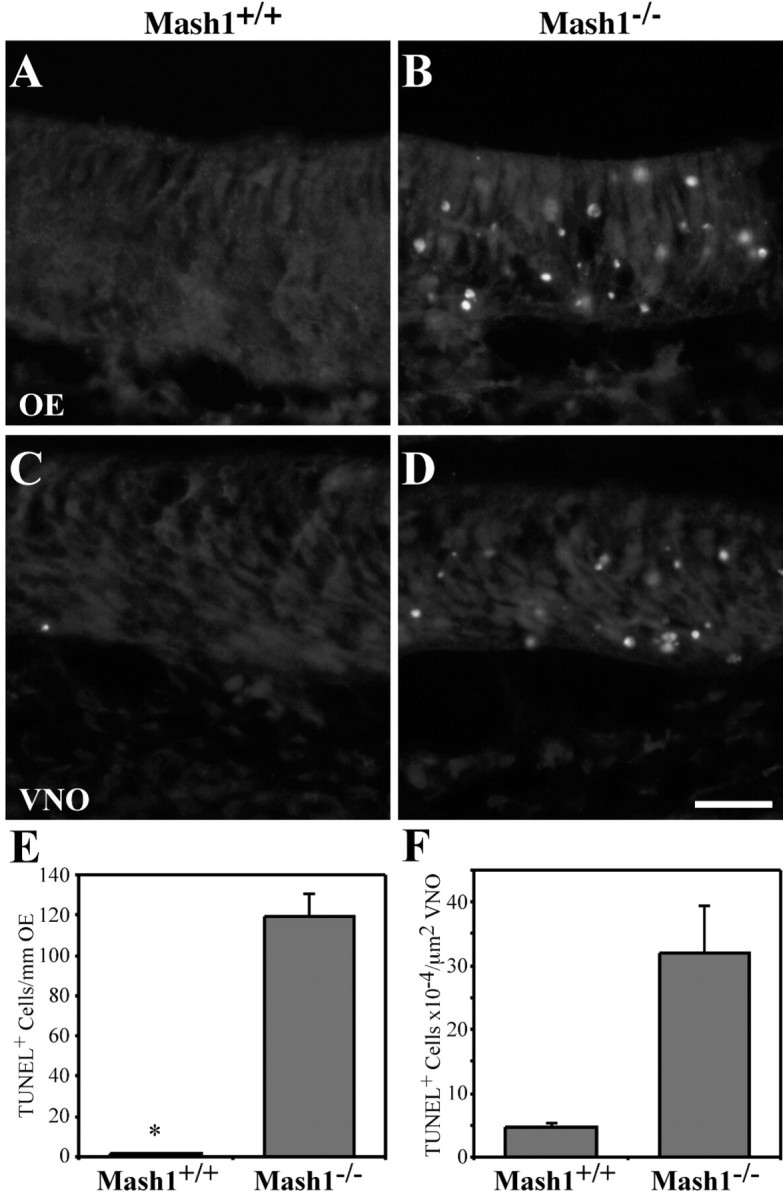
MASH1, a basic helix-loop-helix transcription factor, is widely expressed by neuronal progenitors in the CNS and PNS, suggesting that it plays a role in the development of many neural regions. However, in mice lacking a functional Mash1 gene, major alterations have been reported in only a few neuronal populations; among these is a generalized loss of olfactory receptor neurons of the olfactory epithelium. Here, we use a transgenic reporter mouse line, in which the cell bodies and growing axons of subsets of central and peripheral neurons are marked by expression of a tau-lacZ reporter gene (the Tattler-4 allele), to look both more broadly and deeply at defects in the nervous system of Mash1-/- mice. In addition to the expected lack of olfactory receptor neurons in the main olfactory epithelium, developing Mash1-/-;Tattler-4+/- mice exhibited reductions in neuronal cell number in the vomeronasal organ and in the olfactory bulb; the morphology of the rostral migratory stream, which gives rise to olfactory bulb interneurons, was also abnormal. Further examination of cell proliferation, cell death, and cell type-specific markers in Mash1-/- animals uncovered parallels between the main olfactory epithelium and the vomeronasal organ in the regulation of sensory neuron development. Interestingly, this analysis also revealed that, in the olfactory epithelium of Mash1-/- animals, there is an overproduction of proliferating cells that co-express markers of both neuronal progenitors and supporting cells. This finding suggests that olfactory receptor neurons and olfactory epithelium supporting cells may share a common progenitor, and that expression of Mash1 may be an important factor in determining whether these progenitors ultimately generate neurons or glia.


Figures

Fig. 1.
Fig. 1.
A, Diagram of theTα1:tau-lacZ transgenic construct used to generate Tattler-4 mice. The tau-lacZ reporter fusion is expressed under the control of theTα1 α-tubulinpromoter. A polyadenylation signal from SV40 is included in the construct. A, AscI; X,XhoI; P, PmeI.B-I, Tα1:tau-lacZexpression in Tattler-4 transgenic mice. Expression was visualized by X-gal staining, as detailed in Materials and Methods. B, Sagittal view of E13.5 Tattler-4 transgenic embryo stained with X-gal. Staining is present in the neural retina (NR), olfactory epithelium (OE), olfactory bulb (OB), tectum (T), cerebellum (Cb), dorsal spinal cord (SC), trigeminal ganglion (Vthg), and dorsal root ganglia (DRG). Sensory nerves in the limb (arrow) are also stained. C, Dorsal view of E13.5 embryo. The sympathetic chain (Sym) underlying the spinal cord, dorsal root ganglia (DRG), cutaneous (Cut), and intercostal (In) spinal nerves are stained. D, Transverse section through the spinal cord of an E13.5 embryo. Staining is present in the dorsal spinal cord (SC) and dorsal root ganglia (DRG) as well as in the sympathetic chain (Sym). Staining in the ventral root (VR) likely represents preganglionic sympathetic axons, because the ventral horn motor neurons are not stained. The dorsal aorta (DA) is labeled for reference (dorsal is at the right). E, Horizontal section through the abdomen of an E13.5 embryo. Staining is present in the enteric plexus (Epl) of the developing gut.F, Horizontal section through the head of an E13.5 embryo stained in whole mount. Staining is present at the margin of the cerebral cortex (C), pons (P), cerebellum (Cb), diencephalon (Di), ganglionic eminence (GE), and hippocampus (Hi). The oculomotor (IIIrdn) and trochlear (IVthn) cranial nerves are also stained. G, Horizontal section through the eye of an E16.5 embryo. Prominent staining is present in the retinal ganglion cells (RGC) and their axons in the optic nerve (IIndn). Some staining in the developing outer nuclear layer (ONL) is also apparent. H, Parasagittal section through the head of a P0 animal. Staining is present in the OE,OB, intermediate zone of the cerebral cortex (Ciz), hippocampus (Hi), fimbria (Fim), thalamus (Th), optic chiasm (OC), hypothalamus (Hy), tectum (T), inferior colliculus (IC), cerebellum (Cb), and trigeminal ganglion (Vthg).I, Parasagittal section through the cerebellum of a P0 Tattler-4 mouse. Staining is present in cells of the external granule layer (EGL). Scale bars: D,E, G, I, 100 μm;F, 300 μm; H, 1 mm.
Fig. 2.
Fig. 2.
Alterations in the OE and OB of Mash1−/−mice. A, B, E18.5 littermate embryos heterozygous for the Tattler-4 reporter allele and Mash1+/+ (A) orMash1−/− (B) were sectioned at 30 μm in the sagittal plane and stained with X-gal. Anterior is on the left; dorsal is at the top. The olfactory epithelium (OE), mitral/tufted cell layer (MC), outer nerve layer (NL), olfactory nerve (Istn), and granular layer (asterisk) are shown. Scale bar, 300 μm. C, Diagram to illustrate the measurements taken to quantify changes in OB and AOB size. OB diameter and granular layer (GL) thickness were measured in the plane perpendicular to the cribriform plate, at the point midway between the anterior tip of the OB and the flexure at the junction of the anterior border of the cerebral cortex and the dorsal surface of the OB (labeled brackets). OB diameter was measured as the distance between the dorsal and ventral surfaces of the OB; GL thickness was measured as the distance across the unstained granular layer in X-gal-stained tissue. AOB area (light blue shading) was measured using NIH Image 1.61. D, Decreased OB diameter inMash1−/− embryos. To quantify changes in the size of the OB, serial 30-μm-thick sagittal sections through the entire extent of both OBs were measured in two Mash1−/−;Tattler-4+/−and two Mash1+/+;Tattler-4+/− animals at E18.5. A total of 67–80 measurements were taken per animal and plotted relative to the distance of the measured section from the midline.Mash1−/− embryos (blue lines) and wild-type embryos (red lines) are shown.E, Decreased GL thickness in Mash1−/−embryos. A total of 32–50 measurements were taken per animal and plotted as in D. F, Reduced AOB area in Mash1−/− embryos. A total of 24–35 measurements were taken per animal and plotted as in D.
Fig. 3.
Fig. 3.
Comparison of the rostral migratory stream inMash1−/− and Mash1+/+ embryos.A–D, Thirty micrometer sagittal sections through the head of an E18.5 Mash1+/+;Tattler-4+/− embryo (A, C) and aMash1−/−;Tattler-4+/− littermate (B,D) stained with X-gal. C,D, Higher power images of the regionsbracketed in A and B.E–H, Twelve micrometer sagittal sections through the head of an E17.5 Mash1+/+ embryo (E,G) and a Mash1−/− littermate (F, H) processed for PSA-NCAM immunostaining (monoclonal anti-PSA-NCAM 12F8) (Chung et al., 1991) (E, F) or nuclear DNA staining (bisbenzimide H 33258 counterstain of same sections) (G,H). Inset in Fshows a negative control (no primary antibody) section of forebrain, including a portion of the lateral ventricle, for comparison. Rostral migratory stream (RMS) and ventricular zone (VZ) are shown. Scale bars: (in B)A, B, 250 μm; (in D)C, D, 50 μm; (inH) E–H, 300 μm.
Fig. 4.
Fig. 4.
Alterations in RMS, VZ, and granular layer of the OB in Mash1−/− embryos. A,B, D–K, Sagittal sections, 12 μm (A, B, F,I) and 20 μm (D,E, G, H, J,K), through the heads of E17.5Mash1+/+ embryos (A, D,F–H) and Mash1−/− littermates (B, E, I–K) were processed for BrdU or NeuN immunostaining or in situhybridization for 3′ Mash1 UTR, Gad67, orReelin as indicated. Scale bars: (in B)A, B, 200 μm; (inI) F, I, 100 μm; (in E) D, E,G, H, J, K, 200 μm. C, Quantification of BrdU-incorporating cells in the ventricular zone and granular layer of the OB in Mash1−/− embryos (gray bars) and wild-type (striped bars) littermates. The total number of BrdU+ cells was counted in a series of three 83-μm-wide (approximate width of the ventricular zone) bands proceeding dorsally or ventrally from the OB ventricular surface (inset). Values: Band I, 107 (range, ±11) BrdU+ cells (wild type) and 85.5 (range, ±10.5) BrdU+ cells (Mash1−/−); Band II, 103 (range, ±6) BrdU+ cells (wild type) and 2 (range, ±2) BrdU+ cells (Mash1−/−); Band III, 27 (range, ±2) BrdU+ cells (wild type) and 8.5 (range, +4.5) BrdU+ cells (Mash1−/−).
Fig. 5.
Fig. 5.
Alterations in the VNO of Mash1−/−mice. A, B, Sagittal sections through the VNO of an E18.5 Mash1+/+;Tattler-4+/−embryo (A) and aMash1−/−;Tattler-4+/− littermate (B) stained with X-gal. Anterior is on theleft, and dorsal is at the top.A, Sensory neurons in the VNO epithelium (arrowhead) stain with X-gal as do the vomeronasal nerves (arrows). B, The number of sensory neurons and the size of the VNO (arrowhead) as well as the size of the vomeronasal nerve (arrow) is reduced in the Mash1−/−;Tattler-4+/− littermate. Scale bar, 100 μm.
Fig. 6.
Fig. 6.
Gene expression in the OE and VNO ofMash1−/− embryos. A–P, Coronal sections of E14.5 wild-type OE (A–C) and VNO (G–I) or Mash1−/− littermate OE (D–F) and VNO (J–L) and E17.5 wild-type (M, N) orMash1−/− littermate VNO (O,P) were processed for in situhybridization as described in Materials and Methods. Dorsal is at thetop, and lateral is on the right(A, arrows). Scale bar: (inF) A–F, 20 μm; (in L) G–L, 20 μm; (in P)M–P, 50 μm.
Fig. 7.
Fig. 7.
. BrdU incorporation andMash1 expression in the OE and VNO of Mash1−/−embryos. A–H, E14.5 wild-type (A, B, E,F) and Mash1−/−(C, D, G,H) littermates were sectioned coronally and processed for BrdU immunohistochemistry (A–D) orin situ hybridization with the probe for the 3′Mash1 UTR (E–H). Scale bar: (inC) A, C, E,G, 20 μm; (in D)B, D, F, H, 20 μm.
Fig. 8.
Fig. 8.
. Ncam,Steel, and 3′ Mash1 expression in wild-type and Mash1−/− embryos. A–L, E14.5 (A–F) and E17.5 (G–L) embryos were sectioned in the coronal plane and processed for in situ hybridization. Sustentacular cell layer (SUS), olfactory receptor neuron layer (ORNs), basal lamina (BL), and lamina propria (LP) are shown. Scale bar: (inF) A–F, 10 μm; (in L) G-L, 10 μm.
Fig. 9.
Fig. 9.
Apoptosis in the OE and VNO of Mash1−/−embryos. A–D, E14.5 wild-type (A, C) and Mash1−/−(B, D) littermates were sectioned horizontally at 12 μm and processed for TUNEL labeling as described previously (Holcomb et al., 1995). Scale bar, 20 μm.E, The number of TUNEL+ cells per millimeter of OE was counted in a minimum of 20 fields representing at least 5.2 mm of OE in one animal of each genotype. Values are 1.8 (±0.53 SEM) TUNEL+ cells per millimeter OE for wild-type and 119.8 (± 10.87 SEM) TUNEL+ cells per millimeter OE for Mash1−/−. F, The number of TUNEL+ cells per square micrometers of VNO was counted in a minimum of eight fields representing at least 115,000 μm2 of VNO. Values are 4.64 × 10⁻⁴ (±0.75 SEM) TUNEL+ cells per square micrometer VNO for wild-type and 31.8 × 10⁻⁴(±7.57) TUNEL+ cells per square micrometer VNO forMash1−/−.

Similar articles

Cited by

References

    1. Alvarez-Buylla A. Mechanism of migration of olfactory bulb interneurons. Semin Cell Dev Biol. 1997;8:207–213. - PubMed
    1. Angevine JB., Jr Time of neuron origin in the diencephalon of the mouse. An autoradiographic study. J Comp Neurol. 1970;139:129–187. - PubMed
    1. Barthels D, Santoni MJ, Wille W, Ruppert C, Chaix JC, Hirsch MR, Fontecilla-Camps JC, Goridis C. Isolation and nucleotide sequence of mouse NCAM cDNA that codes for a Mr 79,000 polypeptide without a membrane-spanning region. EMBO J. 1987;6:907–914. - PMC - PubMed
    1. Blaugrund E, Pham TD, Tennyson VM, Lo L, Sommer L, Anderson DJ, Gershon MD. Distinct subpopulations of enteric neuronal progenitors defined by time of development, sympathoadrenal lineage markers and Mash-1-dependence. Development. 1996;122:309–320. - PubMed
    1. Brunet JF, Ghysen A. Deconstructing cell determination: proneural genes and neuronal identity. BioEssays. 1999;21:313–318. - PubMed

Publication types

MeSH terms