Liver-specific mRNA for Insig-2 down-regulated by insulin: implications for fatty acid synthesis
- PMID: 12624180
- PMCID: PMC152262
- DOI: 10.1073/pnas.0130116100
Liver-specific mRNA for Insig-2 down-regulated by insulin: implications for fatty acid synthesis
Abstract
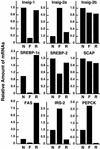
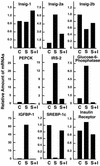
Insig-1 and -2 are closely related proteins of the endoplasmic reticulum (ER) that block proteolytic activation of sterol regulatory element-binding proteins (SREBPs), transcription factors that activate the synthesis of cholesterol and fatty acids in liver and other organs. When cellular cholesterol levels are high, Insig proteins bind and trap SREBP cleavage-activating protein (SCAP), retaining it in the ER and preventing it from escorting SREBPs from ER to the site of proteolytic activation in the Golgi complex. Here, we report the discovery of a liver-specific transcript of Insig-2, designated Insig-2a. This transcript and the ubiquitous transcript, designated Insig-2b, differ through the use of different promoters that produce different noncoding first exons that splice into a common second exon. Although the Insig-2a and -2b mRNAs encode identical proteins, they differ in patterns of regulation. Insig-2a is the predominant transcript in livers of fed animals, and it is selectively down-regulated by insulin. Insig-2a mRNA increases when mice are fasted, and it declines when they are refed. The transcript also increases in livers of rats whose insulin-secreting pancreatic beta cells have been destroyed by streptozotocin, and it is reduced when insulin is injected. The insulin-mediated fall in Insig-2a may allow SREBP-1c to be processed, thereby allowing insulin to stimulate fatty acid synthesis, even under conditions in which hepatic cholesterol levels are elevated.
Figures


Similar articles
-
Overexpression of Insig-1 in the livers of transgenic mice inhibits SREBP processing and reduces insulin-stimulated lipogenesis.J Clin Invest. 2004 Apr;113(8):1168-75. doi: 10.1172/JCI20978. J Clin Invest. 2004. PMID: 15085196 Free PMC article.
-
Insulin enhances the biogenesis of nuclear sterol regulatory element-binding protein (SREBP)-1c by posttranscriptional down-regulation of Insig-2A and its dissociation from SREBP cleavage-activating protein (SCAP).SREBP-1c complex.J Biol Chem. 2009 Nov 13;284(46):31726-34. doi: 10.1074/jbc.M109.050914. Epub 2009 Sep 16. J Biol Chem. 2009. PMID: 19759400 Free PMC article.
-
Insig-2, a second endoplasmic reticulum protein that binds SCAP and blocks export of sterol regulatory element-binding proteins.Proc Natl Acad Sci U S A. 2002 Oct 1;99(20):12753-8. doi: 10.1073/pnas.162488899. Epub 2002 Sep 19. Proc Natl Acad Sci U S A. 2002. PMID: 12242332 Free PMC article.
-
Sterol regulatory element-binding protein family as global regulators of lipid synthetic genes in energy metabolism.Vitam Horm. 2002;65:167-94. doi: 10.1016/s0083-6729(02)65064-2. Vitam Horm. 2002. PMID: 12481547 Review.
-
Sterol regulatory element-binding proteins (SREBPs): transcriptional regulators of lipid synthetic genes.Prog Lipid Res. 2001 Nov;40(6):439-52. doi: 10.1016/s0163-7827(01)00010-8. Prog Lipid Res. 2001. PMID: 11591434 Review.
Cited by
-
1,25-Dihydroxyvitamin D3 modulates adipogenesis of human adipose-derived mesenchymal stem cells dose-dependently.Nutr Metab (Lond). 2021 Mar 12;18(1):29. doi: 10.1186/s12986-021-00561-4. Nutr Metab (Lond). 2021. PMID: 33712053 Free PMC article.
-
SREBPs: metabolic integrators in physiology and metabolism.Trends Endocrinol Metab. 2012 Feb;23(2):65-72. doi: 10.1016/j.tem.2011.10.004. Epub 2011 Dec 7. Trends Endocrinol Metab. 2012. PMID: 22154484 Free PMC article. Review.
-
Comparison of in vivo effects of insulin on SREBP-1c activation and INSIG-1/2 in rat liver and human and rat adipose tissue.Obesity (Silver Spring). 2013 Jun;21(6):1208-14. doi: 10.1002/oby.20134. Obesity (Silver Spring). 2013. PMID: 23913732 Free PMC article.
-
Schoenheimer effect explained--feedback regulation of cholesterol synthesis in mice mediated by Insig proteins.J Clin Invest. 2005 Sep;115(9):2489-98. doi: 10.1172/JCI25614. Epub 2005 Aug 11. J Clin Invest. 2005. PMID: 16100574 Free PMC article.
-
Distinct roles of insulin and liver X receptor in the induction and cleavage of sterol regulatory element-binding protein-1c.Proc Natl Acad Sci U S A. 2005 Jan 18;102(3):791-6. doi: 10.1073/pnas.0405067102. Epub 2005 Jan 6. Proc Natl Acad Sci U S A. 2005. PMID: 15637161 Free PMC article.
References
-
- Goldstein J L, Rawson R B, Brown M S. Arch Biochem Biophys. 2002;397:139–148. - PubMed
Publication types
MeSH terms
Substances
Associated data
- Actions
- Actions
- Actions
- Actions
- Actions
Grants and funding
LinkOut - more resources
Full Text Sources
Molecular Biology Databases

