. 2003 Mar 4;100(5):2975-80.
doi: 10.1073/pnas.0536590100. Epub 2003 Feb 26.

Nuclear and cytosolic calcium are regulated independently

Affiliations

Nuclear and cytosolic calcium are regulated independently

M F Leite et al. Proc Natl Acad Sci U S A. .

Abstract

Nuclear calcium (Ca(2+)) regulates a number of important cellular processes, including gene transcription, growth, and apoptosis. However, it is unclear whether Ca(2+) signaling is regulated differently in the nucleus and cytosol. To investigate this possibility, we examined subcellular mechanisms of Ca(2+) release in the HepG2 liver cell line. The type II isoform of the inositol 1,4,5-trisphosphate (InsP(3)) receptor (InsP(3)R) was expressed to a similar extent in the endoplasmic reticulum and nucleus, whereas the type III InsP(3)R was concentrated in the endoplasmic reticulum, and the type I isoform was not expressed. Ca(2+) signals induced by low InsP(3) concentrations started earlier or were larger in the nucleus than in the cytosol, indicating higher sensitivity of nuclear Ca(2+) stores for InsP(3). Nuclear InsP(3)R channels were active at lower InsP(3) concentrations than InsP(3)R from cytosol. Enriched expression of type II InsP(3)R in the nucleus results in greater sensitivity of the nucleus to InsP(3), thus providing a mechanism for independent regulation of Ca(2+)-dependent processes in this cellular compartment.


Figures
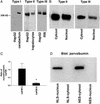
Figure 1
Figure 1
Expression and subcellular distribution of InsP3R isoforms in HepG2 cells. (A) Immunoblot of whole-cell protein demonstrates that HepG2 cells express types II and III but not type I InsP3Rs. Cerebellum, hepatocytes, and RIN-5F cells are used as isoform-specific controls for type I, II, and III InsP3Rs, respectively. The entire lane of each blot is shown. (B) Immunoblot comparing cytosolic and nuclear membrane proteins demonstrates that the type II InsP3R is expressed to a similar extent in both compartments, but the type III InsP3R is relatively decreased in nucleus. Immunoreactive bands were detected at a molecular mass of 240–260 kDa. (C) Densitometry confirms that the type II InP3R is enriched in the nucleus relative to the type III isoform (*, P < 0.025 based on n = 4 blots). (D) Demonstration of the purity of nuclear and cytosolic preparations. Parvalbumin was either targeted to the nucleus with an NLS sequence or excluded from the nucleus by using an NES sequence. NLS-parvalbumin was detected only in the nuclear fraction of HepG2 cells, whereas NES-parvalbumin was detected only in the cytosolic (nonnuclear) fraction.
Figure 2
Figure 2
Subcellular localization of InsP3R isoforms in HepG2 cells. Type II and III InsP3Rs were localized by confocal immunofluorescence. Cells were double-labeled with isoform-specific InsP3R antibodies (green) or with added propidium iodide (red) to identify the nucleus. (A) Type II InsP3R labeling. (B) Propidium iodide. (C) Merged images demonstrate that type II InsP3R is in both cytosol and nucleus. Notice the reticular pattern of nuclear staining. (D) Type III InsP3R labeling. (E) Propidium iodide. (F) Merged images demonstrate that type III InsP3R is in the cytosol but not in the nucleus of HepG2 cells. Labeling with secondary but not primary antibody plus propidium iodide reveals no nonspecific staining (not shown).
Figure 3
Figure 3
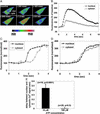
Nuclear and cytosolic Ca2+ signals in HepG2 cells stimulated with extracellular ATP. (A) Serial confocal images of a HepG2 cell stimulated with ATP (10 μM). The cell is loaded with fluo-3, and the images are pseudocolored by using the scale that is shown. A fluorescence increase in the nucleus precedes the increase in the cytosol; the increase in the nucleus is first detectable in part of the nucleus after 280 msec and occurs throughout the nucleus within 420 msec, while the cytosolic increase is not detected until 840 msec have elapsed. (B) Tracing shows nuclear and cytosolic fluorescence in the regions outlined in yellow in the cell shown in A. The increase in nuclear fluorescence slightly precedes the increase in the cytosol, then both increases return toward baseline. (C) Expanded time scale in a similar experiment reveals that Ca2+ increases in the nucleus almost 0.5 sec before Ca2+ increases in the cytosol of another HepG2 cell stimulated with 10 μM ATP. Nuclear and cytosolic Ca2+ signals in C and D are normalized to the same baseline and peak values to facilitate comparison of the two curves. The result is representative of that seen in n = 16 cells. (D) Ca2+ increases simultaneously in the nucleus and cytosol of a HepG2 cell stimulated with 100 μM ATP. The result is representative of that seen in n = 26 cells. (E) Summary of results. Values are mean ± SEM.
Figure 4
Figure 4
Nuclear and cytosolic Ca2+ signals induced by photorelease of caged InsP3. Cells were microinjected with NPE-InsP3 plus fluo-3, then InsP3 was liberated in a controlled fashion by flash photolysis as cells were monitored by time-lapse confocal microscopy. (A) Liberation of 0.2 μM InsP3 results in a small increase in nuclear Ca2+, and an even smaller increase in cytosolic Ca2+. (B) Liberation of 9 μM InsP3 results in much greater increases in nuclear and cytosolic Ca2+, where the magnitude of the signal is greater in the cytosol than in the nucleus. (C) Summary of flash photolysis studies. Individual data points show the peak nuclear vs. cytosolic fluorescence (relative to baseline) in each of 60 observations. The identity line is shown for reference, to illustrate where data points would lie if nuclear and cytosolic fluorescence were equal. The regression curve for these data is: (% increase in cytosol) = 1.27 × (% increase in nucleus) − 39.2 (R2 = 0.92; P < 0.00001), which demonstrates that nuclear Ca2+ increases more than cytosolic Ca2+ for small Ca2+ signals, but that cytosolic Ca2+ increases more than nuclear Ca2+ for larger Ca2+ signals (main graph). Note that nuclear Ca2+ signals predominate when the Ca2+ transient is <140% of baseline (see Inset).
Figure 5
Figure 5
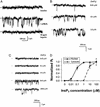
InsP3 dependence of InsP3R channels from HepG2 nuclear and ER membranes. (A) Single-channel recordings of InsP3Rs from HepG2 nuclear membranes. (Top) After fusion of vesicles from HepG2 cell nuclear membranes, no channel activity was observed in the presence of 4 μM ruthenium red (to inhibit non-InsP3-dependent Ca2+ channels), 0.5 mM ATP (which is an InsP3R coagonist), and 10 μM Ca2+ at the cytosolic side with Ba2+ as the current carrier. Addition of 1 μM InsP3 to the cytosolic side induced channel activity. (Middle) Channel openings can be seen here and in subsequent tracings as downward deflections from the baseline. The bar to the left of each tracing here and subsequently indicates the baseline. (Bottom) Addition of 50 μg/ml heparin blocked InsP3R channel activity specifically (representative of n = 4 experiments). Similar results were obtained with vesicles from cytosolic HepG2 membrane preparations (not shown). (B) Increasing amounts of InsP3 added to the cytosolic (nucleoplasmic) side of the InsP3R channel from HepG2 cell nuclear membranes increase channel activity. Shown are traces with InsP3 concentrations of 10 nM (Top), 100 nM (Middle), and 1 μM (Bottom). (C) Increasing amounts of InsP3 added to the cytosolic side of the InsP3R channel from HepG2 cell ER membranes increase channel activity. Shown are traces with InsP3 concentrations of 10 nM, 100 nM, 1 μM, 10 μM, and 100 μM (Top to Bottom). (D) InsP3R from HepG2 cell nuclei are more sensitive than ER InsP3R to InsP3. Membranes from both cell compartments show increasing activity with increased concentrations of InsP3 at the cytosolic/nucleoplasmic side. Nuclear channels are already active at 10 nM InsP3 and reach a plateau at 1 μM InsP3. Regression analysis of nuclear InsP3R activity dependence on the InsP3 concentration shows half-maximal activity at 64 nM InsP3. In contrast, ER channels are not active until they are above 1 μM InsP3, when they also reach a plateau. Regression analysis of ER InsP3R activity dependence on the InsP3 concentration shows half-maximal activity at 3.7 μM InsP3. This figure shows the normalized open probability (P0) for ER and nuclear InsP3Rs; the absolute P0 using 100 μM InsP3 is 7.4% and 2.9% for ER and nuclear receptors, respectively. The averages of at least three single-channel experiments and their SEs are shown for each data point.

Similar articles

Cited by

References

    1. Clapham D E. Cell. 1995;80:259–268. - PubMed
    1. Berridge M J, Lipp P, Bootman M D. Nat Rev Mol Cell Biol. 2000;1:11–21. - PubMed
    1. Carrion A M, Link W A, Ledo F, Mellstrom B, Naranjo J R. Nature. 1999;398:80–84. - PubMed
    1. Chawla S, Hardingham G E, Quinn D R, Bading H. Science. 1998;281:1505–1509. - PubMed
    1. Hardingham G E, Chawla S, Johnson C M, Bading H. Nature. 1997;385:260–265. - PubMed

Publication types

MeSH terms

LinkOut - more resources