Comparative Study
. 2003;4(1):R4.
doi: 10.1186/gb-2002-4-1-r4. Epub 2002 Dec 31.

Microarray analysis of orthologous genes: conservation of the translational machinery across species at the sequence and expression level

Affiliations
Comparative Study

Microarray analysis of orthologous genes: conservation of the translational machinery across species at the sequence and expression level

Jose L Jiménez et al. Genome Biol. 2003.

Abstract

Background: Genome projects have provided a vast amount of sequence information. Sequence comparison between species helps to establish functional catalogues within organisms and to study how they are maintained and modified across phylogenetic groups during evolution. Microarray studies allow us to determine groups of genes with similar temporal regulation and perhaps also common regulatory upstream regions for binding of transcription factors. The integration of sequence and expression data is expected to refine our current annotations and provide some insight into the evolution of gene regulation across organisms.

Results: We have investigated how well the protein subcellular localization and functional categories established from clustering of orthologous genes agree with gene-expression data in Saccharomyces cerevisiae. An increase in the resolution of biologically meaningful classes is observed upon the combination of experiments under different conditions. The functional categories deduced by sequence comparison approaches are, in general, preserved at the level of expression and can sometimes interact into larger co-regulated networks, such as the protein translation process. Differences and similarities in the expression between cytoplasmic-mitochondrial and interspecies translation machineries complement evolutionary information from sequence similarity.

Conclusions: Combination of several microarray experiments is a powerful tool for the identification of upstream regulatory motifs of yeast genes involved in protein synthesis. Comparison of these yeast co-regulated genes against the archaeal and bacterial operons indicates that the components of the protein translation process are conserved across organisms at the expression level with minor specific adaptations.


Figures

Figure 1
Figure 1
Correlation inconsistency in the expression of some gene pairs between different experiments. For each gene pair, CCF values obtained from combining expression profiles of all experiments (CCFTOTAL, x-axis) are plotted versus those of individual experiments (CCFEXPERIMENT, y-axis). Only gene pairs with a CCFTOTAL value above 0.5 or below -0.5 are shown. x- and y-axis values go from -1 to 1 in steps of 0.5 as depicted in (a). (b-d) Genes involved in the cell cycle: (b) alpha-factor, (c) elutriation and (d) cdc-15 strain. (e) Sporulation. (f, g) Response to stress: (f) heat and (g) cold shocks. (h) Diauxic shift. CCFEXPERIMENT values can spread over a considerable range regardless of their CCFTOTAL (for example, heat shock), even to the point of being significant and with opposite sign to CCFTOTAL (for example, cold stress and diauxic shift). This inconsistency is less pronounced in the sporulation data, perhaps because it contains very high intensity values that may bias the CCFTOTAL to be more similar to CCFspo. Note that only genes whose expression was increased or decreased by 2.3-fold were considered. Those that did not pass the filtering were given a value equal to zero.
Figure 2
Figure 2
Proteins localized in the same compartment tend to be expressed at the same time. The plots show the trend for the percentage of genes from the same compartment (%LOC, y-axis) with respect to the total number of genes to which they correlate at a given threshold (CCF, x-axis). The solid lines correspond to the values obtained from the experimental data, whereas the dashed lines are the values expected by chance. The expected trend matches with that of a set of proteins with unknown localization (a), in contrast to sets of proteins with identified compartment: (b) mitochondrion, (c) endoplasmic reticulum, (d) plasma membrane, (e) cytoplasm and (f) nucleus.
Figure 3
Figure 3
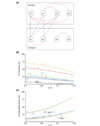
Agreement of functional annotation and expression data of genes. (a) Two groups of genes obtained after an a priori classification by, for example, functional annotation. The red lines connecting the elements within each group represent significant similarity between their expression profiles. The number of red lines with respect to all possible ones gives and indication of the consistency of the group. Thus, group a is very consistent, as all the possible connections but one, a3-a4, are made. On the other hand, the consistency of group b is poorer, as its elements form two subgroups (b1-b2 and b3-b4). The blue lines connecting the elements between each group are relations lost upon the a priori classification used. The higher the number of lost connections the less comprehensive the classification will be. In this case, the subgroup b1-b2 significantly correlates with group a. (b) Consistency of the functional groups established by gene annotation. A decreasing trend implies loss of interactions between members. F--, -P-, FP-, F-L, -PL and FPL indicate functional classes as defined in the text. For example, class F-- contains all gene pairs in which both members have the same general function regardless of their pathway/system (P) or location (L), class FP- contains all gene pairs with the same general function and the same pathway/system but not necessarily the same location, and so on. (c) Comprehensiveness of significant gene-expression pairs in the functional groups established by gene annotation. The increasing trend suggests that genes correlating at high CCF values tend to belong to the same functional class. This is especially obvious when a broad functional classification is used in which nearly all the possible pairs in the experiment are represented at high thresholds. The percentage of the gene pairs in each group with respect to the total number of pairs was: ALL (100%), F-- (8.8%), -P- (1.2%), FP- (4%), F-L (6.7%), -PL (1%) and FPL (3.1%). The group --- was not included in the -P- and -PL classes.
Figure 4
Figure 4
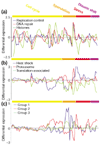
Examples of gene subgrouping within broad functional classes. Expression profiles for several sets of genes after combining experiments under different conditions. The experiments are color-coded (upper bar) as follows: yellow (cell cycle), orange (sporulation), red (stress) and purple (diauxic shift). (a) Subgroups obtained from the 'L - -' class ('DNA replication, recombination and repair'). (b) Subgroups obtained from the 'O - -' class ('post-translational modification, protein turnover and chaperones'). (c) Subgroups obtained from the 'GEPR - -' class, which contains permeases of the major facilitator superfamily. GEPR comprises several functional groups reflecting that their actual function is not clear (R) although they may be involved in the transport of sugars (G), aminoacids (E) and inorganic ions (P). The vertical axis represents the differential expression of genes as the log ratio of the mRNA abundance in experimental versus control samples. At zero values, the mRNA levels are identical. The list of genes included in every subgroup can be found in the additional data files.
Figure 5
Figure 5
'DNA replication-related' genes. The experiments are color-coded as in Figure 4. (a) The four subgroups with very similar periodic profiles are shown. As mentioned in the text, they correspond to DNA repair and replication, thymidylate biosynthesis, and chromosome partitioning. (b) Profile obtained by averaging those shown in (a).
Figure 6
Figure 6
Motifs found in upstream regions of genes involved in protein synthesis. (a-c) The motif logo and the distribution of scores from the matches of these motifs to the upstream regions of all yeast genes (dark blue) or just to those from which the motif was built (red). (a) The motif rap1 presents a periodicity that roughly corresponds to the pitch of a DNA helix and is similar to the sequence repeat found in telomeres, which is also targeted by the protein Rap1 [64]. (b) The motif rrpe contains an A-rich patch followed by a T-rich patch. The lengths of these two patches vary between genes. This motif may be palindromic. (c) The motif pac is made of highly conserved residues (around 100%) at several neighboring positions. (d) Ratio of genes in the cytoplasmic protein translation set and all S. cerevisiae genes matching at a given score to rap1 (purple), rrpe (red) and pac (orange) motifs.
Figure 7
Figure 7
Cytoplasmic versus mitochondrial translation machinery. (a, b) The distribution of CCF values for gene pairs in which both members belong to the COG functional category J, protein translation. (a) The distribution of CCF values for gene pairs in which both members are mitochondrial proteins (dark blue) or one member is mitochondrial and the another one is not (red). (b) The distribution of CCF values for gene pairs in which both members are cytoplasmic (orange), both nuclear (red), or one member is cytoplasmic and the another one is nuclear (dark blue). (c) The averaged expression profiles of the mitochondrial translation machinery (dark blue) and the set of genes involved in protein translation in the cytoplasm, including those involved in the metabolism of sugar, amino acids and nucleotides, as well as RNA processing proteins and polymerases. The color-coding for the experiments is the same as in Figure 4. (d) Distribution of CCF values for pairs of genes that belong to the same COG. The cytoplasmic pairs (dark blue) correspond to paralog-paralog relationships whereas the ones involving cytoplasmic and mitochondrial proteins (red) correspond to orthologs. The expression of duplicated genes can be distinguished from each other because even though two genes can encode two proteins with identical amino-acid sequences, the degree of identity at the DNA level can be low enough to make a selective DNA hybridization onto the chip feasible. This seems to be the case for the genes analyzed in (d).
Figure 8
Figure 8
Procedure for splitting genes of the same functional class into finer subgroups. See text for details.
Figure 9
Figure 9
The range of CCF values for the selected classes and their genes. The red dots are the CCFs of the expression profiles of all the genes versus the averaged profile of the class they belong to. The blue points correspond to the means after averaging the CCFs of all the genes within a class.

Similar articles

Cited by

References

    1. Blattner FR, Plunkett G, Bloch CA, Perna NT, Burland V, Riley M, Collado-Vides J, Glasner JD, Rode CK, Mayhew GF, et al. The complete genome sequence of Escherichia coli K-12. Science. 1997;277:1453–474. - PubMed
    1. Nierman WC, Feldblyum TV, Laub MT, Paulsen IT, Nelson KE, Eisen J, Heidelberg JF, Alley MR, Ohta N, Maddock JR, et al. Complete genome sequence of Caulobacter crescentus. Proc Natl Acad Sci USA. 2001;98:4136–4141. - PMC - PubMed
    1. Klenk HP, Clayton RA, Tomb JF, White O, Nelson KE, Ketchum KA, Dodson RJ, Gwinn M, Hickey EK, Peterson JD, et al. The complete genome sequence of the hyperthermophilic, sulphate-reducing archaeon Archaeoglobus fulgidus. Nature. 1997;390:364–370. - PubMed
    1. Ruepp A, Graml W, Santos-Martinez ML, Koretke KK, Volker C, Mewes HW, Frishman D, Stocker S, Lupas AN, Baumeister W. The genome sequence of the thermoacidophilic scavenger Thermoplasma acidophilum. Nature. 2000;407:508–513. - PubMed
    1. The C. elegans Sequencing Consortium Genome sequence of the nematode C. elegans: a platform for investigating biology. Science. 1998;282:2012–2018. - PubMed

Publication types

LinkOut - more resources