Direct visualization of Ras proteins in spatially distinct cell surface microdomains
- PMID: 12527752
- PMCID: PMC2172642
- DOI: 10.1083/jcb.200209091
Direct visualization of Ras proteins in spatially distinct cell surface microdomains
Abstract
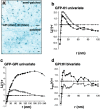
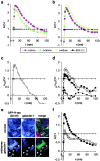
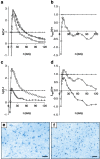
Localization of signaling complexes to specific microdomains coordinates signal transduction at the plasma membrane. Using immunogold electron microscopy of plasma membrane sheets coupled with spatial point pattern analysis, we have visualized morphologically featureless microdomains, including lipid rafts, in situ and at high resolution. We find that an inner-plasma membrane lipid raft marker displays cholesterol-dependent clustering in microdomains with a mean diameter of 44 nm that occupy 35% of the cell surface. Cross-linking an outer-leaflet raft protein results in the redistribution of inner leaflet rafts, but they retain their modular structure. Analysis of Ras microlocalization shows that inactive H-ras is distributed between lipid rafts and a cholesterol-independent microdomain. Conversely, activated H-ras and K-ras reside predominantly in nonoverlapping, cholesterol-independent microdomains. Galectin-1 stabilizes the association of activated H-ras with these nonraft microdomains, whereas K-ras clustering is supported by farnesylation, but not geranylgeranylation. These results illustrate that the inner plasma membrane comprises a complex mosaic of discrete microdomains. Differential spatial localization within this framework can likely account for the distinct signal outputs from the highly homologous Ras proteins.
Figures


Similar articles
-
Activated K-Ras and H-Ras display different interactions with saturable nonraft sites at the surface of live cells.J Cell Biol. 2002 May 27;157(5):865-72. doi: 10.1083/jcb.200202009. Epub 2002 May 20. J Cell Biol. 2002. PMID: 12021258 Free PMC article.
-
Lipid raft localization of GABA A receptor and Na+, K+-ATPase in discrete microdomain clusters in rat cerebellar granule cells.Neurochem Int. 2005 May;46(6):489-99. doi: 10.1016/j.neuint.2004.11.010. Neurochem Int. 2005. PMID: 15769551
-
Lipid rafts and plasma membrane microorganization: insights from Ras.Trends Cell Biol. 2004 Mar;14(3):141-7. doi: 10.1016/j.tcb.2004.02.001. Trends Cell Biol. 2004. PMID: 15003623 Review.
-
Clustering of raft-associated proteins in the external membrane leaflet modulates internal leaflet H-ras diffusion and signaling.Mol Cell Biol. 2006 Oct;26(19):7190-200. doi: 10.1128/MCB.01059-06. Mol Cell Biol. 2006. PMID: 16980621 Free PMC article.
-
Ras proteins: different signals from different locations.Nat Rev Mol Cell Biol. 2003 May;4(5):373-84. doi: 10.1038/nrm1105. Nat Rev Mol Cell Biol. 2003. PMID: 12728271 Review.
Cited by
-
The formation of ordered nanoclusters controls cadherin anchoring to actin and cell-cell contact fluidity.J Cell Biol. 2015 Jul 20;210(2):333-46. doi: 10.1083/jcb.201410111. J Cell Biol. 2015. PMID: 26195669 Free PMC article.
-
FLIM-FRET Analysis of Ras Nanoclustering and Membrane-Anchorage.Methods Mol Biol. 2021;2262:233-250. doi: 10.1007/978-1-0716-1190-6_13. Methods Mol Biol. 2021. PMID: 33977480
-
Hemagglutinin clusters in the plasma membrane are not enriched with cholesterol and sphingolipids.Biophys J. 2015 Apr 7;108(7):1652-1659. doi: 10.1016/j.bpj.2015.02.026. Biophys J. 2015. PMID: 25863057 Free PMC article.
-
Regulation of T cell function by protein S-acylation.Front Physiol. 2022 Nov 16;13:1040968. doi: 10.3389/fphys.2022.1040968. eCollection 2022. Front Physiol. 2022. PMID: 36467682 Free PMC article. Review.
-
Hierarchical nanostructure and synergy of multimolecular signalling complexes.Nat Commun. 2016 Jul 11;7:12161. doi: 10.1038/ncomms12161. Nat Commun. 2016. PMID: 27396911 Free PMC article.
References
-
- Anderson, R., and K. Jacobson. 2002. A role for lipid shells in targeting proteins to caveolae, rafts and other lipid domains. Science. 296:1821–1825. - PubMed
-
- Besag, J.E. 1977. Contribution to the discussion of Dr. Ripley's paper. J. R. Statist. Soc. B39:193–195.
-
- Besag, J., and P.J. Diggle. 1977. Simple Monte Carlo tests for spatial pattern. Appl. Stat. 26:327–333.
-
- Bos, J.L. 1989. ras oncogenes in human cancer: a review. Cancer Res. 49:4682–4689. - PubMed
-
- Brown, D., and E. London. 1998. Functions of lipid rafts in biological membranes. Annu. Rev. Cell Dev. Biol. 14:111–136. - PubMed
Publication types
MeSH terms
Substances
LinkOut - more resources
Full Text Sources
Other Literature Sources
Research Materials
Miscellaneous

