

Voxel-based morphometric analysis of gray matter in first episode schizophrenia
- PMID: 12498745
- PMCID: PMC2845166
- DOI: 10.1006/nimg.2002.1296
Voxel-based morphometric analysis of gray matter in first episode schizophrenia
Abstract
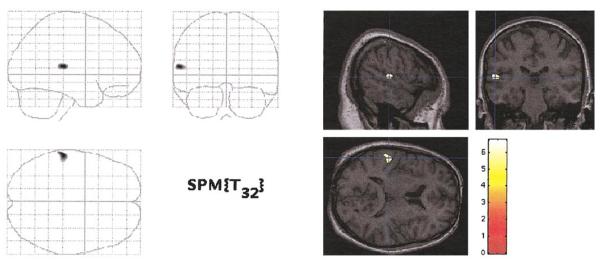
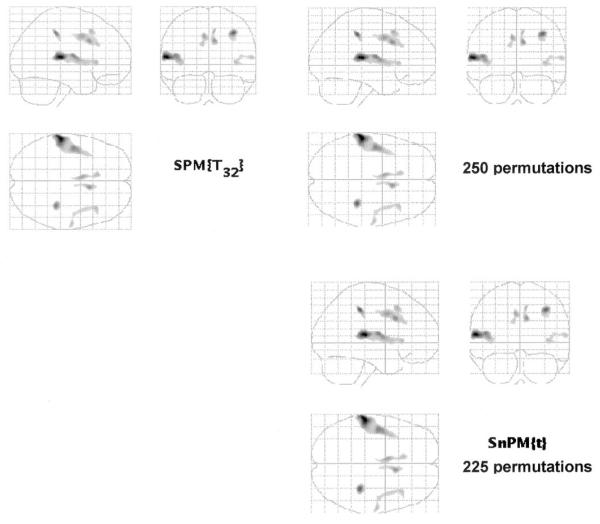
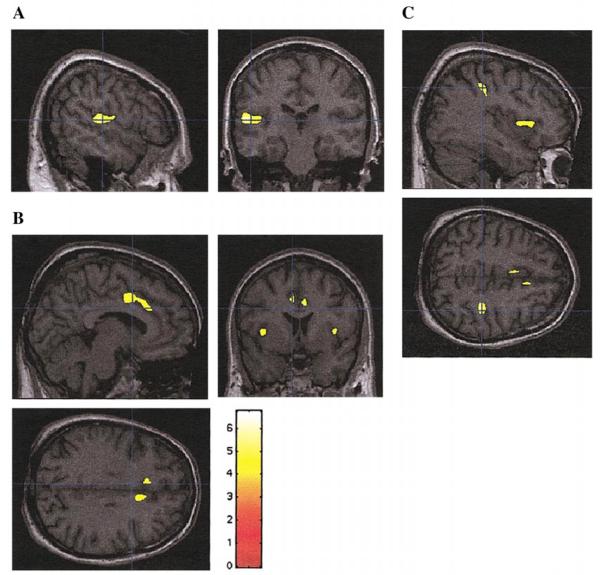
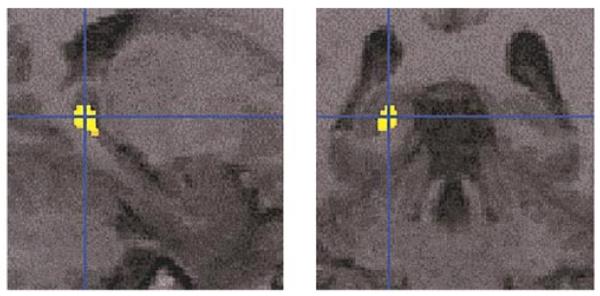
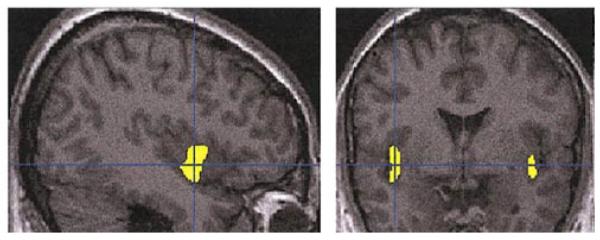
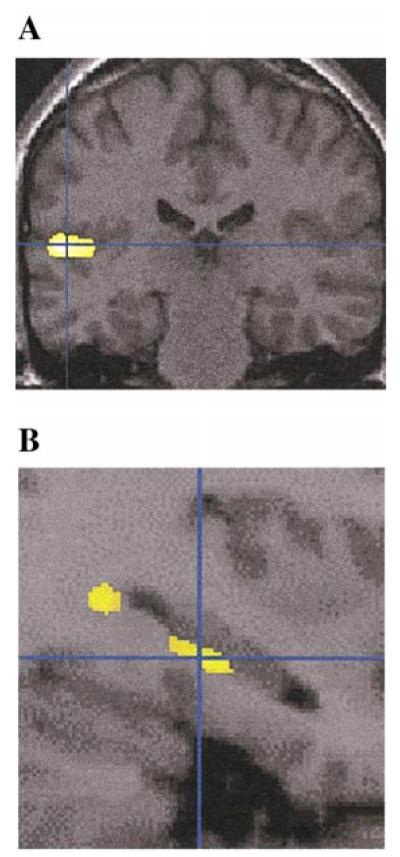
Voxel-based morphometry (VBM) may afford a more rapid and extensive survey of gray matter abnormalities in schizophrenia than manually drawn region of interest (ROI) analysis, the current gold standard in structural MRI. Unfortunately, VBM has not been validated by comparison with ROI analyses, nor used in first-episode patients with schizophrenia or affective psychosis, who lack structural changes associated with chronicity. An SPM99-based implementation of VBM was used to compare a group of 16 patients with first-episode schizophrenia and a group of 18 normal controls and, as a further comparison, 16 first-episode patients with affective psychosis. All groups were matched for age and handedness. High spatial resolution structural images were normalized to the SPM99 template and then segmented, smoothed, and subjected to an ANCOVA. Schizophrenia vs control group comparisons: Voxel-by-voxel comparison of gray matter densities showed that only the left STG region was significantly different when corrected for multiple comparisons (P <.05), consistent with our previously reported manual ROI results. Analysis of the extent of voxel clusters, replicated with permutation analyses, revealed group differences in bilateral anterior cingulate gyri and insula (not previously examined by us with manually drawn ROI) and unilateral parietal lobe, but not in medial temporal lobe (where our ROI analysis had shown differences). However, use of a smaller smoothing kernel and a small volume correction revealed left-sided hippocampal group differences. Affective psychosis comparisons: When the same statistical thresholding criteria were used, no significant differences between affective psychosis patients and controls were noted. Since a major interest was whether patients with affective psychosis shared some anatomical abnormalities with schizophrenia, we applied a small volume correction and searched within the regions that were significantly less dense in schizophrenia compared to control subjects. With this statistical correction, the insula showed, bilaterally, the same pattern of differences in affective disorder subjects as that in schizophrenic subjects, whereas both left STG and left hippocampus showed statistical differences between affectives and schizophrenics, indicating the abnormalities specific to first-episode schizophrenia. These findings suggest both the promise and utility of VBM in evaluating gray matter abnormalities. They further suggest the importance of comparing VBM findings with more traditional ROI analyses until the reasons for the differences between methods are determined.
Figures
Similar articles
-
Differences and similarities in insular and temporal pole MRI gray matter volume abnormalities in first-episode schizophrenia and affective psychosis.Arch Gen Psychiatry. 2003 Nov;60(11):1069-77. doi: 10.1001/archpsyc.60.11.1069. Arch Gen Psychiatry. 2003. PMID: 14609882
-
Progressive decrease of left superior temporal gyrus gray matter volume in patients with first-episode schizophrenia.Am J Psychiatry. 2003 Jan;160(1):156-64. doi: 10.1176/appi.ajp.160.1.156. Am J Psychiatry. 2003. PMID: 12505815 Free PMC article.
-
Middle and inferior temporal gyrus gray matter volume abnormalities in first-episode schizophrenia: an MRI study.Am J Psychiatry. 2006 Dec;163(12):2103-10. doi: 10.1176/ajp.2006.163.12.2103. Am J Psychiatry. 2006. PMID: 17151161 Free PMC article.
-
Decreased left middle temporal gyrus volume in antipsychotic drug-naive, first-episode schizophrenia patients and their healthy unaffected siblings.Schizophr Res. 2013 Mar;144(1-3):37-42. doi: 10.1016/j.schres.2012.12.018. Epub 2013 Jan 27. Schizophr Res. 2013. PMID: 23360727 Review.
-
Regional deficits in brain volume in schizophrenia: a meta-analysis of voxel-based morphometry studies.Am J Psychiatry. 2005 Dec;162(12):2233-45. doi: 10.1176/appi.ajp.162.12.2233. Am J Psychiatry. 2005. PMID: 16330585 Review.
Cited by
-
Regional prefrontal cortex gray matter volumes in youth at familial risk for schizophrenia from the Harvard Adolescent High Risk Study.Schizophr Res. 2010 Oct;123(1):15-21. doi: 10.1016/j.schres.2010.06.015. Epub 2010 Aug 11. Schizophr Res. 2010. PMID: 20705433 Free PMC article.
-
Gray matter in first-episode schizophrenia before and after antipsychotic drug treatment. Anatomical likelihood estimation meta-analyses with sample size weighting.Schizophr Bull. 2011 Jan;37(1):199-211. doi: 10.1093/schbul/sbp099. Epub 2009 Sep 16. Schizophr Bull. 2011. PMID: 19759093 Free PMC article.
-
Structural brain changes associated with antipsychotic treatment in schizophrenia as revealed by voxel-based morphometric MRI: an activation likelihood estimation meta-analysis.BMC Psychiatry. 2013 Dec 20;13:342. doi: 10.1186/1471-244X-13-342. BMC Psychiatry. 2013. PMID: 24359128 Free PMC article.
-
Elucidating neuroanatomical alterations in the at risk mental state and first episode psychosis: a combined voxel-based morphometry and voxel-based cortical thickness study.Schizophr Res. 2013 Nov;150(2-3):505-11. doi: 10.1016/j.schres.2013.08.030. Epub 2013 Sep 29. Schizophr Res. 2013. PMID: 24084578 Free PMC article.
-
Cognitive performance is related to cortical grey matter volumes in early stages of schizophrenia: a population-based study of first-episode psychosis.Schizophr Res. 2009 Sep;113(2-3):200-9. doi: 10.1016/j.schres.2009.06.020. Epub 2009 Jul 17. Schizophr Res. 2009. PMID: 19616413 Free PMC article.
References
-
- Andreasen NC, Arndt S, Swayze V, 2nd, Cizadlo T, Flaum M, O’Leary D, Ehrhardt JC, Yuh WT. Thalamic abnormalities in schizophrenia visualized through magnetic resonance image averaging. Science. 1994;266:294–298. [see comments] - PubMed
-
- Arndt S, Cizadlo T, Andreasen NC, Heckel D, Gold S, O’Leary DS. Tests for comparing images based on randomization and permutation methods. J. Cereb. Blood Flow Metab. 1996;16:1271–1279. - PubMed
-
- Ashburner J, Friston K. Multimodal image coregistration and partitioning—A unified framework. Neuroimage. 1997;6:209–217. - PubMed
-
- Ashburner J, Friston KJ. Voxel-based morphometry— The methods. Neuroimage. 2000;11:805–821. - PubMed
-
- Ashburner J, Friston KJ. Comments and controversies. Why voxel-based morphometry should be used. Neuroimage. 2001;14:1238–1243. - PubMed
Publication types
MeSH terms
Grants and funding
- R01 MH040799/MH/NIMH NIH HHS/United States
- R01 MH040799-16/MH/NIMH NIH HHS/United States
- R01 MH050740/MH/NIMH NIH HHS/United States
- R01 RR011747-02/RR/NCRR NIH HHS/United States
- K02 MH001110-10/MH/NIMH NIH HHS/United States
- P41 RR013218-02/RR/NCRR NIH HHS/United States
- 11747/PHS HHS/United States
- R01 MH 50747/MH/NIMH NIH HHS/United States
- R01 MH050740-09/MH/NIMH NIH HHS/United States
- K02 MH 01110/MH/NIMH NIH HHS/United States
- P41 1321/PHS HHS/United States
- P41 RR013218/RR/NCRR NIH HHS/United States
- R01 MH 40799/MH/NIMH NIH HHS/United States
- MH 52807/MH/NIMH NIH HHS/United States
- R01 MH052807/MH/NIMH NIH HHS/United States
- R01 MH052807-06/MH/NIMH NIH HHS/United States
LinkOut - more resources
Full Text Sources
Medical
