

Phosphorylation of the D1 photosystem II reaction center protein is controlled by an endogenous circadian rhythm
- PMID: 12481090
- PMCID: PMC166718
- DOI: 10.1104/pp.013441
Phosphorylation of the D1 photosystem II reaction center protein is controlled by an endogenous circadian rhythm
Abstract
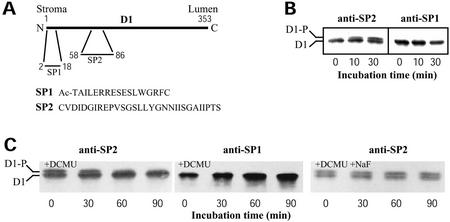
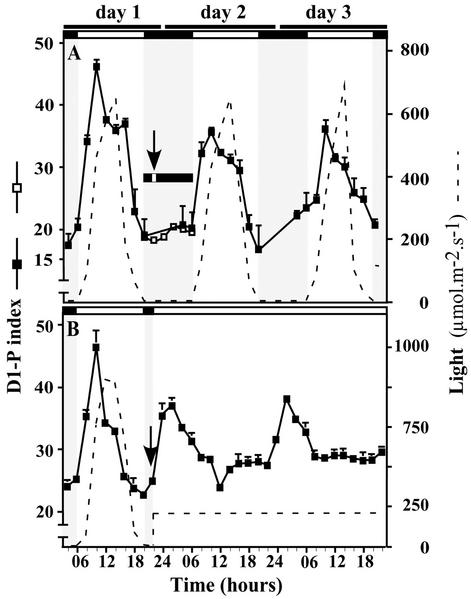
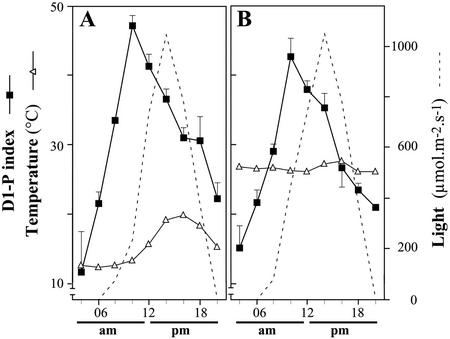
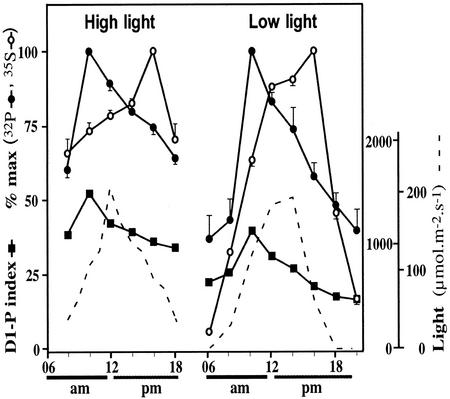
The light dependence of D1 phosphorylation is unique to higher plants, being constitutive in cyanobacteria and algae. In a photoautotrophic higher plant, Spirodela oligorrhiza, grown in greenhouse conditions under natural diurnal cycles of solar irradiation, the ratio of phosphorylated versus total D1 protein (D1-P index: [D1-P]/[D1] + [D1-P]) of photosystem II is shown to undergo reproducible diurnal oscillation. These oscillations were clearly out of phase with the period of maximum in light intensity. The timing of the D1-P index maximum was not affected by changes in temperature, the amount of D1 kinase activity present in the thylakoid membranes, the rate of D1 protein synthesis, or photoinhibition. However, when the dark period in a normal diurnal cycle was cut short artificially by transferring plants to continuous light conditions, the D1-P index timing shifted and reached a maximum within 4 to 5 h of light illumination. The resultant diurnal oscillation persisted for at least two cycles in continuous light, suggesting that the rhythm is endogenous (circadian) and is entrained by an external signal.
Figures
Similar articles
-
Differential D1 dephosphorylation in functional and photodamaged photosystem II centers. Dephosphorylation is a prerequisite for degradation of damaged D1.J Biol Chem. 1996 Jun 21;271(25):14870-5. doi: 10.1074/jbc.271.25.14870. J Biol Chem. 1996. PMID: 8663006
-
Degradation of the D1- and D2-proteins of photosystem II in higher plants is regulated by reversible phosphorylation.Biochemistry. 1995 Dec 12;34(49):16022-9. doi: 10.1021/bi00049a016. Biochemistry. 1995. PMID: 8519758
-
Active oxygen produced during selective excitation of photosystem I is damaging not only to photosystem I, but also to photosystem II.Plant Physiol. 2001 Apr;125(4):2007-15. doi: 10.1104/pp.125.4.2007. Plant Physiol. 2001. PMID: 11299380 Free PMC article.
-
Quality control of photosystem II.Plant Cell Physiol. 2001 Feb;42(2):121-8. doi: 10.1093/pcp/pce022. Plant Cell Physiol. 2001. PMID: 11230565 Review.
-
Molecular recognition in thylakoid structure and function.Trends Plant Sci. 2001 Jul;6(7):317-26. doi: 10.1016/s1360-1385(01)02010-6. Trends Plant Sci. 2001. PMID: 11435171 Review.
Cited by
-
Regulation of photosynthetic electron transport and photoinhibition.Curr Protein Pept Sci. 2014;15(4):351-62. doi: 10.2174/1389203715666140327105143. Curr Protein Pept Sci. 2014. PMID: 24678670 Free PMC article. Review.
-
The circadian night depression of photosynthesis analyzed in a herb, Pulmonaria vallarsae. Day/night quantitative relationships.Photosynth Res. 2022 Nov;154(2):143-153. doi: 10.1007/s11120-022-00956-1. Epub 2022 Sep 10. Photosynth Res. 2022. PMID: 36087250 Free PMC article.
-
Quantitative Circadian Phosphoproteomic Analysis of Arabidopsis Reveals Extensive Clock Control of Key Components in Physiological, Metabolic, and Signaling Pathways.Mol Cell Proteomics. 2015 Aug;14(8):2243-60. doi: 10.1074/mcp.M114.047183. Epub 2015 Jun 19. Mol Cell Proteomics. 2015. PMID: 26091701 Free PMC article.
-
The circadian regulation of photosynthesis.Photosynth Res. 2014 Feb;119(1-2):181-90. doi: 10.1007/s11120-013-9811-8. Epub 2013 Mar 26. Photosynth Res. 2014. PMID: 23529849 Review.
-
Differential expression and phylogenetic analysis suggest specialization of plastid-localized members of the PHT4 phosphate transporter family for photosynthetic and heterotrophic tissues.Plant Signal Behav. 2008 Oct;3(10):784-90. doi: 10.4161/psb.3.10.6666. Plant Signal Behav. 2008. PMID: 19513231 Free PMC article.
References
-
- Allen JF. Protein phosphorylation in regulation of photosynthesis. Biochim Biophys Acta. 1992;1098:275–335. - PubMed
-
- Anderson SL, Kay SA. Illuminating the mechanism of the circadian clock in plants. Trends Plant Sci. 1996;1:51–57.
-
- Aro E-M, Virgin I, Andersson B. Photoinhibition of photosystem II inactivation, protein damage and turnover. Biochim Biophys Acta. 1993;1143:113–134. - PubMed
Publication types
MeSH terms
Substances
LinkOut - more resources
Full Text Sources
