

Poliovirus-induced apoptosis is reduced in cells expressing a mutant CD155 selected during persistent poliovirus infection in neuroblastoma cells
- PMID: 12477887
- PMCID: PMC140570
- DOI: 10.1128/jvi.77.1.790-798.2003
Poliovirus-induced apoptosis is reduced in cells expressing a mutant CD155 selected during persistent poliovirus infection in neuroblastoma cells
Abstract
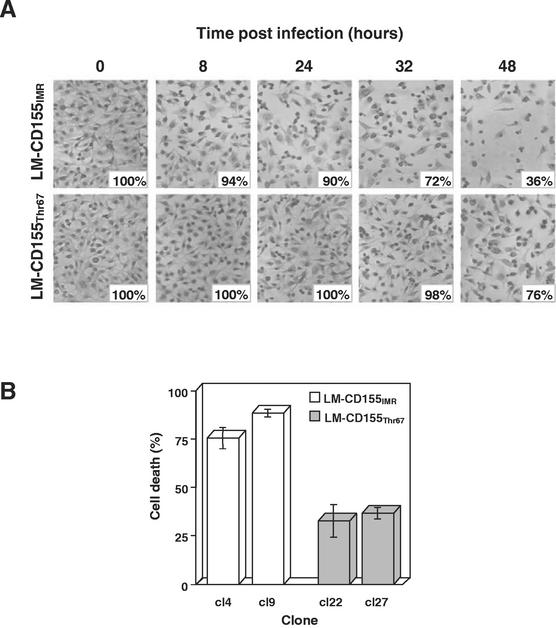
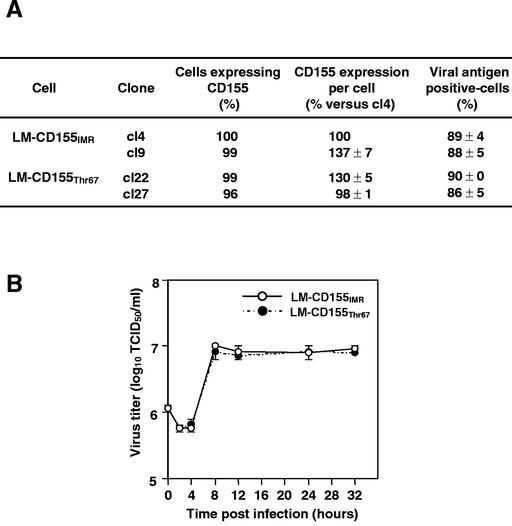
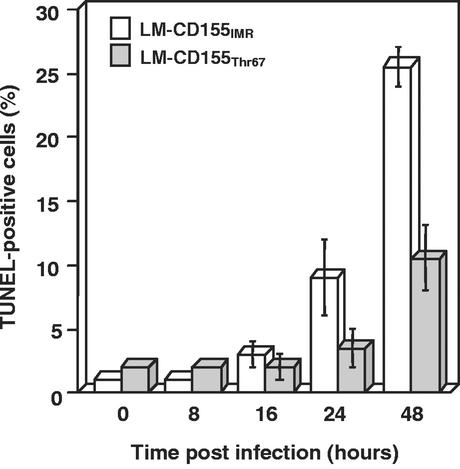
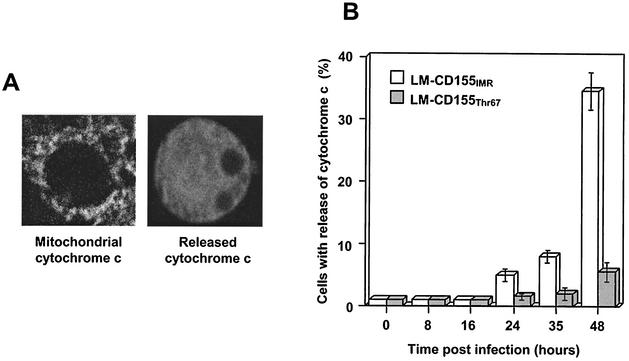
Poliovirus (PV) can establish persistent infections in human neuroblastoma IMR-32 cells. We previously showed that during persistent infection, specific mutations were selected in the first extracellular domain of the PV receptor (CD155) of these cells (N. Pavio, T. Couderc, S. Girard, J. Y. Sgro, B. Blondel, and F. Colbère-Garapin, Virology 274:331-342, 2000). These mutations included the Ala 67 --> Thr substitution, corresponding to a previously described allelic form of the PV receptor. The mutated CD155(Thr67) and the nonmutated IMR-32 CD155 (CD155(IMR)) were expressed independently in murine LM cells lacking the CD155 gene. Following infection of the cells with PV, we analyzed the death of cells expressing these two forms of CD155. Levels of DNA fragmentation, caspase activity, and cytochrome c release were lower in LM-CD155(Thr67) cells than in LM-CD155(IMR) cells. Thus, the level of apoptosis was lower in cells expressing mutated CD155 selected during persistent PV infection in IMR-32 than in cells expressing the wild-type receptor.
Figures
Similar articles
-
Expression of mutated poliovirus receptors in human neuroblastoma cells persistently infected with poliovirus.Virology. 2000 Sep 1;274(2):331-42. doi: 10.1006/viro.2000.0462. Virology. 2000. PMID: 10964776
-
Oncolytic treatment and cure of neuroblastoma by a novel attenuated poliovirus in a novel poliovirus-susceptible animal model.Cancer Res. 2007 Mar 15;67(6):2857-64. doi: 10.1158/0008-5472.CAN-06-3713. Cancer Res. 2007. PMID: 17363609
-
Reduced apoptosis in human intestinal cells cured of persistent poliovirus infection.J Virol. 2007 Mar;81(6):3033-6. doi: 10.1128/JVI.01960-06. Epub 2006 Dec 27. J Virol. 2007. PMID: 17192301 Free PMC article.
-
[Analysis of dissemination pathways for poliovirus].Uirusu. 2009 Jun;59(1):107-14. doi: 10.2222/jsv.59.107. Uirusu. 2009. PMID: 19927995 Review. Japanese.
-
Poliovirus, pathogenesis of poliomyelitis, and apoptosis.Curr Top Microbiol Immunol. 2005;289:25-56. doi: 10.1007/3-540-27320-4_2. Curr Top Microbiol Immunol. 2005. PMID: 15791950 Review.
Cited by
-
Human astrocytic cells support persistent coxsackievirus B3 infection.J Virol. 2013 Nov;87(22):12407-21. doi: 10.1128/JVI.02090-13. Epub 2013 Sep 11. J Virol. 2013. PMID: 24027313 Free PMC article.
-
Calcium flux between the endoplasmic reticulum and mitochondrion contributes to poliovirus-induced apoptosis.J Virol. 2010 Dec;84(23):12226-35. doi: 10.1128/JVI.00994-10. Epub 2010 Sep 22. J Virol. 2010. PMID: 20861253 Free PMC article.
-
TGF-beta1 suppresses T cell infiltration and VP2 puff B mutation enhances apoptosis in acute polioencephalitis induced by Theiler's virus.J Neuroimmunol. 2007 Oct;190(1-2):80-9. doi: 10.1016/j.jneuroim.2007.07.026. Epub 2007 Sep 4. J Neuroimmunol. 2007. PMID: 17804084 Free PMC article.
-
Oral poliovirus vaccine-induced programmed cell death involves both intrinsic and extrinsic pathways in human colorectal cancer cells.Oncolytic Virother. 2018 Oct 30;7:95-105. doi: 10.2147/OV.S177260. eCollection 2018. Oncolytic Virother. 2018. PMID: 30464928 Free PMC article.
-
Poliovirus induces Bax-dependent cell death mediated by c-Jun NH2-terminal kinase.J Virol. 2007 Jul;81(14):7504-16. doi: 10.1128/JVI.02690-06. Epub 2007 May 9. J Virol. 2007. PMID: 17494073 Free PMC article.
References
-
- Agol, V. I., G. A. Belov, K. Bienz, D. Egger, M. S. Kolesnikova, N. T. Raikhlin, L. I. Romanova, E. A. Smirnova, and E. A. Tolskaya. 1998. Two types of death of poliovirus-infected cells: caspase involvement in the apoptosis but not cytopathic effect. Virology 252:343-353. - PubMed
-
- Agre, J. C., A. A. Rodriguez, and K. B. Sperling. 1989. Symptoms and clinical impressions of patients seen in a post-polio clinic. Arch. Phys. Med. Rehabil. 70:367-370. - PubMed
-
- Ammendolia, M. G., A. Tinari, A. Calcabrini, and F. Superti. 1999. Poliovirus infection induces apoptosis in CaCo-2 cells. J. Med. Virol. 59:122-129. - PubMed
-
- Aoki, J., S. Koike, I. Ise, Y. Satoyoshida, and A. Nomoto. 1994. Amino acid residues on human poliovirus receptor involved in interaction with poliovirus. J. Biol. Chem. 269:8431-8438. - PubMed
Publication types
MeSH terms
Substances
LinkOut - more resources
Full Text Sources
Medical
Research Materials
