. 2002 Dec;12(12):1860-70.
doi: 10.1101/gr.110702.

Domain regulation of imprinting cluster in Kip2/Lit1 subdomain on mouse chromosome 7F4/F5: large-scale DNA methylation analysis reveals that DMR-Lit1 is a putative imprinting control region

Affiliations

Domain regulation of imprinting cluster in Kip2/Lit1 subdomain on mouse chromosome 7F4/F5: large-scale DNA methylation analysis reveals that DMR-Lit1 is a putative imprinting control region

Hitomi Yatsuki et al. Genome Res. 2002 Dec.

Erratum in

Abstract

Mouse chromosome 7F4/F5, where the imprinting domain is located, is syntenic to human 11p15.5, the locus for Beckwith-Wiedemann syndrome. The domain is thought to consist of the two subdomains Kip2 (p57(kip2))/Lit1 and Igf2/H19. Because DNA methylation is believed to be a key factor in genomic imprinting, we performed large-scale DNA methylation analysis to identify the cis-element crucial for the regulation of the Kip2/Lit1 subdomain. Ten CpG islands (CGIs) were found, and these were located at the promoter sites, upstream of genes, and within intergenic regions. Bisulphite sequencing revealed that CGIs 4, 5, 8, and 10 were differentially methylated regions (DMRs). CGIs 4, 5, and 10 were methylated paternally in somatic tissues but not in germ cells. CGI8 was methylated in oocyte and maternally in somatic tissues during development. Parental-specific DNase I hypersensitive sites (HSSs) were found near CGI8. These data indicate that CGI8, called DMR-Lit1, is not only the region for gametic methylation but might also be the imprinting control region (ICR) of the subdomain.


Figures

Figure 1
Figure 1
Imprinting domain and a schematic physical map of mouse 7F4/F5. The relative position of the genes is based on previously published data. The imprinting status is shown by filled circles (paternally expressed), open circles (maternally expressed), and gray circles (biallelic expression). The locations of the Kip2/Lit1 and Igf2/H19 subdomains are shown below the map.
Figure 2
Figure 2
Detailed methylation status of CpG islands (CGIs) in the Kip2/Lit1 subdomain. At the top is a schematic gene cluster based on the sequences obtained in the Kip2/Lit1 subdomain. The numbers above the line show a summation based on the sequences, which includes one gap. The imprinting status is shown by filled boxes (paternally expressed), open boxes (maternally expressed), and gray boxes (biallelic expression). Exons of Kvlqt1 are depicted as vertical bars. The transcriptional orientation of genes is indicated by horizontal arrowheads. Middle, a schematic CGI. According to sequencing results, a total of 10 CGIs (CGIs 1–10) were identified. The thick horizontal lines below the line indicate the sequenced regions, with GenBank accession nos. Bottom, the detailed methylation status of CGIs in somatic tissues. Each circle represents a CpG dinucleotide on the strand: (●) a methylated cytosine; (○) an unmethylated cytosine. Paternal and maternal alleles were distinguished by DNA polymorphism, as presented in Table 1. Bisulphite sequencing was performed in adult kidney, embryo (10.5 dpc), and placenta (8.5 dpc) DNAs. The placenta was used when it was proved the gene was expressed monoallelically in this tissue. In adult kidney, at least 10 clones were sequenced from each parental allele. Primers are described in Methods. The first 20 CpGs of the analyzed CGIs are presented and numbered from 1–20 from the left. F1 hybrid mice used were all BPF1. M, maternal; P, paternal.
Figure 3
Figure 3
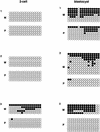
Methylation status in gametes. (A) Nonparental methylation of CGIs 4 and 5 in sperm. (Top) Schematic structure of CGIs 4 and 5 in and around p57Kip2. The bent arrow indicates a transcriptional start site; the open box on the line represents p57Kip2. The gray boxes below the line represent CGIs 4 and 5. The methylation status of sperm genomic DNA is presented. (B) Nonparental methylation of CGI10 in sperm. The methylation status of sperm genomic DNA is presented in Tssc4 promoter. (C) Gametic methylation of CGI8 in oocyte but not in sperm. The methylation status of CGIs 8a and 8b is shown in sperm and oocyte. In oocyte, clones are grouped by separate PCRs. The schematic presentation is the same as shown in Fig. 2. However, the first 11 and first 16 CpGs are presented in CGI8a and CGI8b, respectively. These were analyzed by bisulphite sequencing in BPF1.
Figure 3
Figure 3
Methylation status in gametes. (A) Nonparental methylation of CGIs 4 and 5 in sperm. (Top) Schematic structure of CGIs 4 and 5 in and around p57Kip2. The bent arrow indicates a transcriptional start site; the open box on the line represents p57Kip2. The gray boxes below the line represent CGIs 4 and 5. The methylation status of sperm genomic DNA is presented. (B) Nonparental methylation of CGI10 in sperm. The methylation status of sperm genomic DNA is presented in Tssc4 promoter. (C) Gametic methylation of CGI8 in oocyte but not in sperm. The methylation status of CGIs 8a and 8b is shown in sperm and oocyte. In oocyte, clones are grouped by separate PCRs. The schematic presentation is the same as shown in Fig. 2. However, the first 11 and first 16 CpGs are presented in CGI8a and CGI8b, respectively. These were analyzed by bisulphite sequencing in BPF1.
Figure 4
Figure 4
Methylation status of CGI8b in preimplantation embryos. The methylation status of two-cell and blastocyst DNAs was analyzed in CGI8b. The presentation is basically the same as in Fig. 3C. Clones are grouped by separate PCRs. Independent experiments were performed several times; representative results are shown. The primers are described in Methods. F1 hybrid embryos used here are all BPF1.
Figure 5
Figure 5
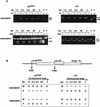
Parental expression and methylation of p57Kip2 and Lit1 during development. (A) Allelic expression and methylation of p57Kip2 and Lit1 in F1 mice. The mRNA and genomic DNA obtained from various tissues were used for RT-PCR and genomic PCR, respectively. HpaII and HhaI indicate restriction enzymes used for methylation-sensitive genomic PCR; +, digested; −, not digested. Tissues used for analyses were as follows: 7.5, 10.5, and 18.5 dpc embryos; NB, whole newborn; K, adult kidney; B, adult B6 kidney; P, adult PWK kidney. RT indicates reverse transcription; +, transcriptase added; −, no transcriptase. Primers are described in Methods. Two alleles were distinguished as described in Methods. F1 hybrid mice were all BPF1. (B) (Top) Schematic structure of p57Kip2, Lit1, and Kvlqt1. (Bottom) Schematic pattern of expression and methylation during development for p57Kip2 and Lit1, respectively. In expression, +, expressed; −, nonexpressed. In methylation, +, methylated; −, nonmethylated.
Figure 6
Figure 6
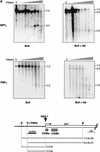
Parental-specific DNaseI HSSs near and around CGIs 4, 5, and 8. (A) DNaseI HSS on paternal allele near CGI8. Nuclei isolated from BPF1 or PBF1 primary fibroblast in mice were treated with an increasing amount of DNase I. After extraction, the DNA was digested with BclI or BclI and HindIII as indicated and subjected to Southern blotting analysis. The blots were probed with 1 kb of fragment amplified with the primer sets Lit-3 and Lit-5. The diagram shown below depicts Lit1 gene and CGI8 surrounded by restriction sites, with the start of transcription represented by the bent arrow; gray boxes below the gene represent CGI8a and 8b. Downward arrowhead indicates a nuclease HSS detected on the paternal chromosome, designated HSS-1. B, BclI; H, HindIII. HindIII is the polymorphic recognition site in PWK but not in B6 mouse. (B) HSS on maternal allele around CGIs 4 and 5. The same DNase I-treated DNA was used as above and treated similarly. DraI and BspH1 were used. BspH1 is the polymorphic restriction site in B6 mouse. The probe is a p57Kip2 cDNA. The HSSs obtained were designated HSS-2 and HSS-3. D, DraI; B, BspH1.
Figure 6
Figure 6
Parental-specific DNaseI HSSs near and around CGIs 4, 5, and 8. (A) DNaseI HSS on paternal allele near CGI8. Nuclei isolated from BPF1 or PBF1 primary fibroblast in mice were treated with an increasing amount of DNase I. After extraction, the DNA was digested with BclI or BclI and HindIII as indicated and subjected to Southern blotting analysis. The blots were probed with 1 kb of fragment amplified with the primer sets Lit-3 and Lit-5. The diagram shown below depicts Lit1 gene and CGI8 surrounded by restriction sites, with the start of transcription represented by the bent arrow; gray boxes below the gene represent CGI8a and 8b. Downward arrowhead indicates a nuclease HSS detected on the paternal chromosome, designated HSS-1. B, BclI; H, HindIII. HindIII is the polymorphic recognition site in PWK but not in B6 mouse. (B) HSS on maternal allele around CGIs 4 and 5. The same DNase I-treated DNA was used as above and treated similarly. DraI and BspH1 were used. BspH1 is the polymorphic restriction site in B6 mouse. The probe is a p57Kip2 cDNA. The HSSs obtained were designated HSS-2 and HSS-3. D, DraI; B, BspH1.
Figure 7
Figure 7
Imprinting regulation of Kip2/Lit1 subdomain by DMR-Lit1. Expression and DNA methylation status of imprinting cluster in this domain are depicted. The hypothetical mechanism of DMR-Lit-1 is described in the Discussion. Bent arrows indicate a parental-dependent transcription. Horizontal arrows pointing toward left show hypothetical enhancers that were suggested to exist experimentally (Cleary et al. 2001; John et al. 2001). Lollipops represent CGIs 1 to 10. Closed lollipops: methylated DNA; open lollipops: nonmethylated DNA. M, maternal allele; P, paternal allele. HSS-1, HSS-2, and HSS-3 show nuclease-hypersensitive sites near CGI8, CGI4, and CGI5, respectively. Not drawn to scale.

Similar articles

Cited by

References

    1. Avner P, Heard E. X-chromosome inactivation: Counting, choice and initiation. Nat Rev Genet. 2001;2:59–67. - PubMed
    1. Baylin SB, Esteller M, Rountree MR, Bachman KE, Schuebel K, Herman JG. Aberrant patterns of DNA methylation, chromatin formation and gene expression in cancer. Hum Mol Genet. 2001;10:687–692. - PubMed
    1. Ben-Porath I, Cedar H. Imprinting: Focusing on the center. Curr Opin Genet Dev. 2000;10:550–554. - PubMed
    1. Bourchis D, Xu GL, Lin CS, Bollman B, Bestor TH. Dnmt3L and the establishment of maternal genomic imprints. Science. 2001;294:2536–2539. - PubMed
    1. Caspary T, Cleary MA, Baker CC, Guan XJ, Tilghman SM. Multiple mechanisms regulate imprinting of the mouse distal chromosome 7 gene cluster. Mol Cell Biol. 1998;18:3466–3474. - PMC - PubMed

Publication types

MeSH terms

LinkOut - more resources