. 2002 Dec 1;22(23):10333-45.
doi: 10.1523/JNEUROSCI.22-23-10333.2002.

Histone deacetylase activity is necessary for oligodendrocyte lineage progression

Affiliations

Histone deacetylase activity is necessary for oligodendrocyte lineage progression

Mireya Marin-Husstege et al. J Neurosci. .

Abstract

Gene expression can be modulated by chromatin changes induced by histone acetylation and deacetylation. Acetylation of histone lysine residues by acetyltransferases is associated with transcriptionally active chromatin, whereas the removal of acetyl groups by histone deacetylases (HDACs) correlates with repressed chromatin. Recent evidence has shown that histone deacetylation is responsible for restricting neuronal gene expression, whereas histone acetylation is necessary for astrocytic differentiation We now asked whether histone acetylation or deacetylation was necessary for oligodendrocyte differentiation. Neonatal rat cortical progenitors were kept proliferating and undifferentiated in the presence of mitogens and induced to stop proliferating and differentiate into oligodendrocytes by mitogen removal. Histone deacetylation was observed during the temporal window between exit from the cell cycle and onset of differentiation, which was characterized by acquisition of branched morphology and myelin gene expression. Blocking HDAC activity during this critical window using the inhibitor trichostatin A (TSA) prevented the progression of progenitors into mature oligodendrocytes. TSA-treated progenitors were able to exit from the cell cycle but did not progress to oligodendrocytes. Their development was arrested at the progenitor stage, characterized by simple morphology and lack of myelin gene expression. The effect of TSA on progenitor differentiation was lineage specific, because TSA did not affect the ability of these cells to differentiate into type II astrocytes when cultured in the presence of serum. From these data, we conclude that histone deacetylation is a necessary component of the oligodendrocyte differentiation program.


Figures
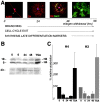
Fig. 1.
Fig. 1.
Histone deacetylation during oligodendrocyte differentiation. A, Schematic representation of oligodendrocyte lineage progression. Oligodendrocyte progenitors can be isolated from the cortex of neonatal rats and cultured in the presence of mitogens. In these conditions, cells have a simple morphology and express the A2B5 marker for early progenitors and the O4 marker for late progenitors. After removal of mitogens from the culture medium, cells exit from the cell cycle, elaborate secondary and tertiary branches, and, between 48 and 72 hr, begin synthesis of GalC, the major lipid constituent of myelin. After 96 hr from the removal of mitogens, cells express high levels of the protein constituent of myelin, PLP. B, Time course of protein deacetylation during oligodendrocyte development. Protein lysates were obtained from proliferating progenitors cultured in the presence of bFGF (0), from cells cultured for 6 (6), 24 (24), or 48 (48) hr in the absence of bFGF, and from cells treated for 24 hr with 10 ng/ml TSA in medium without bFGF. After SDS-PAGE and transfer onto nitrocellulose, the blots were probed with antibodies anti-acetyl lysine, and the bands were visualized by chemiluminescence. The size of the molecular weight markers is indicated on theleft. The intensity of the chemiluminescent signal reflects the acetylation level. Reprobing the blots with anti-actin antibodies was used as loading control. C, Densitometric analysis of histone acetylation. Western blot analysis was performed as described in B using four different cellular preparations. The results of the four experiments were then scanned with a densitometer, quantitated, normalized, and represented as a bar graph. Briefly, the intensity of the signal of each band was measured and normalized by the actin content. The signal of the band detected in progenitors cultured in bFGF was arbitrarily chosen as 100% value, and the acetylation of each sample was referred to as a percentage of that value.
Fig. 2.
Fig. 2.
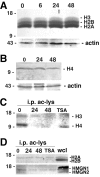
Changes in chromatin components during oligodendrocyte lineage progression. A, The steady-state levels of histones H2A, H2B, and H3 do not change during oligodendrocyte lineage progression. Protein lysates were obtained from proliferating progenitors cultured in bFGF (0) and from cells cultured for 6 (6), 24 (24), or 48 (48) hr in the absence of this mitogen. After separation by electrophoresis, the blots were probed with a mixture of three antibodies recognizing total histones H3, H2A, and H2B. Controls for loading of proteins were obtained probing the same blot for actin. B, The steady-state levels of histone H4 do not change during oligodendrocyte lineage progression. Protein lysates were obtained from proliferating progenitors cultured in bFGF (0) and from cells cultured for 6 (6), 24 (24), or 48 (48) hr in the absence of this mitogen. After separation by electrophoresis, the blots were probed with antibodies recognizing total histone H4. Reprobing with actin was used as loading control. C, Histones H3 and H4 are deacetylated. Protein lysates isolated from progenitor cells cultured in the presence of bFGF (0) or in the absence of mitogens for 24 or 48 hr, with (TSA) or without (24, 48) trichostatin A, were immunoprecipitated using anti-acetyl lysine antibodies (i.p. ac-lys). The blots were probed using anti-histone H3 and anti-histone H4 antibodies. D, Histone H2A and HMGN1 are deacetylated. Protein lysates were obtained from cells cultured in the conditions described in C. Samples were immunoprecipitated using antibodies recognizing acetyl lysine residues and then probed with anti-H2A, -H2B, -HMGN1, and -HMGN2 antibodies. The presence of H2A, H2B, HMGN1, and HMGN2 in the cells before immunoprecipitation was evaluated by including a whole cell lysate control (wcl).
Fig. 3.
Fig. 3.
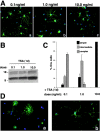
Inhibition of histone deacetylation prevents morphological differentiation of oligo progenitors.A, Dose-dependent effect of TSA in preventing morphological changes associated with differentiation. Photomicrograph of progenitors cultured for 1 d in the absence of TSA or in the presence of 0.1 ng/ml (b), 1 ng/ml (c), or 10 ng/ml (d) TSA. The green immunofluorescence indicates O4-positive cells. The blue immunofluorescence (DAPI) identifies all cell nuclei. Cells treated with increasing doses of TSA display a progressively simpler morphology. B, Dose-dependent effect of TSA in inducing changes in acetylation. Western blot analysis of protein lysates obtained from cells treated for 24 hr with 0.1, 1, or 10 ng/ml TSA (+TSA). After SDS-PAGE, the blots were probed with anti-acetyl lysine antibodies. C, Quantitation of the TSA effect on the morphology of cells. Oligodendrocyte progenitors were allowed to differentiate by removal of mitogens from the medium containing 0.1, 1, or 10 ng/ml TSA for 24 hr. After staining live with O4, cells were fixed, processed by immunofluorescence, and then classified in each of the following categories: simple morphology, intermediate morphology, or complex morphology. Cells were classified as simple morphology if they only had short primary branches and bulky processes. Cells were classified as intermediate morphology if they had long primary or secondary branches. Cells were classified as complex morphology if they had tertiary branches. D, Effect of sodium butyrate on the morphology of the cells. Oligodendrocyte progenitors were treated with either 0.5 mm (a) or 5 mm(b) sodium butyrate. Only concentrations that are known to inhibit histone deacetylase (b) have an effect on progenitors morphology.
Fig. 4.
Fig. 4.
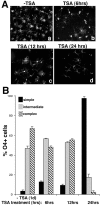
The effect of TSA is time dependent.A, Population analysis of the TSA-dependent effect. Photomicrograph of O4-positive cells cultured for 48 hr in medium without mitogens (a, −TSA) or cultured for 6 hr (b), 12 hr (c), or 24 hr (d) in the presence of 10 ng/ml TSA, followed by an additional 24 hr of culture in the absence of TSA. Cells were fixed and stained for O4. Stable changes were observed only after 24 hr treatment. B, Quantitation of the TSA-dependent effect. O4-positive cells were analyzed under a fluorescence microscope and classified as either simple, intermediate, or complex morphology, as described in Figure 3C. The bar graph represents the results of the counts from four to six determinations resulting from two or three experiments each performed in duplicate.
Fig. 5.
Fig. 5.
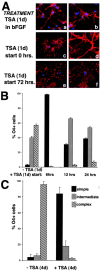
The effect of TSA in preventing morphological differentiation depends on when the treatment started.A, Effect of TSA on the morphology. Cells were cultured for 24 hr in the presence of TSA (b, d,f) or in its absence (a,c, e) and then stained for O4 (a, d) and PLP (e,f). TSA treatment did not change the morphology of progenitors cultured in bFGF (a, b). In addition, TSA treatment neither “reverted” the branching of cells cultured for 72 hr in the absence of mitogens (e, f) nor affected the expression of PLP by these cells. B, Quantitation of the effect of 24 hr TSA treatment started at different time points on the morphology of the cells. Oligo progenitors were cultured in medium without mitogens for 6, 12, or 24 hr (−TSA) and then treated with TSA for the next 24 hr (+TSA). After staining with the O4 marker, cells were analyzed by immunofluorescence and classified according to their morphology. Note that the effect of TSA on the morphology of the cells occurs only if the treatment is started early after mitogen withdrawal. C, Effect of 4 d treatment. Treatment of cells with 10 ng/ml TSA for 4 d completely prevented branching when it was started immediately after mitogen withdrawal.
Fig. 6.
Fig. 6.
Treatment of oligodendrocyte progenitors with TSA arrests the cells at an immature stage of differentiation.A, TSA prevents the expression of late oligodendrocyte differentiation markers. To test the effect of histone deacetylation on the synthesis of lineage-specific markers, progenitors were cultured for 5 d without mitogens in the absence (−TSA) or presence (+TSA) of TSA. Cells were then processed for immunocytochemistry using antibodies against A2B5 (red,a, b), O4 (red,c, d), GalC (green,e, f), and PLP (green, g, h). Cell nuclei were visualized using DAPI (blue fluorescence ina–h). Typically, after 5 d of mitogen withdrawal, control cells have lost immunoreactivity for the progenitor marker A2B5 (a) but express O4 (c), GalC (e), and PLP (g). Preventing histone deacetylation with TSA halters the progression from progenitors to mature oligodendrocytes. TSA-treated cells do not express GalC and PLP (f, h) but express O4 (d) and the progenitor marker A2B5 (b). Scale bar, 20 μm. B, TSA lowers the RNA levels of CGT and PLP. To determine whether the lack of GalC and PLP immunoreactivity in TSA-treated cells was attributable to an effect on the RNA levels, a semiquantitative RT-PCR was performed. Briefly, RNA was isolated from untreated progenitors cultured in bFGF (bFGF) or differentiated in mitogen-free medium for 1 d (1d) or 3 d (3d). For TSA-treated cultures, the inhibitor was kept in the medium for 1 d (1d + TSA) or 3 d (3d + TSA) after mitogen withdrawal. After conversion into cDNA, the same amount was amplified using primers specific for actin, CGT, and PLP.
Fig. 7.
Fig. 7.
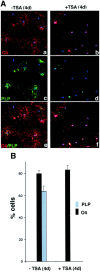
Inhibition of histone deacetylase activity prevents the progression of O4+ cells to a mature phenotype. A, TSA treatment prevents branching and PLP expression. Oligodendrocyte progenitors were allowed to differentiate by removing the mitogens from the culture medium in the absence (a, c, e) or presence (b, d, f) of 10 ng/ml TSA. The medium was replaced every other day, and, after 4 d, cells were stained with antibodies against O4 (red immunofluorescence in a,b and e, f) and PLP (green immunofluorescence in c,d and e, f). DAPI (blue immunofluorescence) was used to identify cell nuclei. B, TSA treatment reduces the proportion of cells expressing PLP. After immunohistochemistry, treated and untreated cells were examined under a fluorescence microscope, and three fields were counted from three distinct experiments, each performed in duplicate. The bar graphs represent the results of the quantitation.
Fig. 8.
Fig. 8.
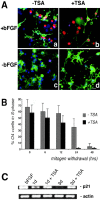
Inhibition of histone deacetylation blocks differentiation but not cell cycle exit. A, BrdU incorporation in TSA-treated cultures. Progenitors were kept proliferating in the presence of bFGF (a,b) or were allowed to differentiate by removing the mitogen from the medium (c, d) in the presence (b, d) or absence (a, c) of 10 ng/ml TSA. Cells in S phase were pulse labeled for 6 hr with 10 μm BrdU at 6, 12, 24, and 48 hr and then identified by positive immunoreactivity for BrdU (red) and O4+(green) to identify proliferating cells. DAPI (blue) was used to identify all the cell nuclei. Scale bar, 20 μm. B, TSA treatment does not increase the number of cells in S phase. The number of double-labeled O4+/BrdU+ cells was counted and expressed as a percentage of the total number of O4+cells. The graybars represent the number of proliferating cells in the untreated cultures, whereas theblackbars represent the number of proliferating cells in the TSA-treated cultures. C, The RNA levels of the cell cycle inhibitor p21 are increased by TSA. RNA was isolated from progenitors cultured in the absence or presence of 10 ng/ml TSA. Amplification of the mRNA was performed by semiquantitative RT-PCR. Actin levels were measured as internal control.
Fig. 9.
Fig. 9.
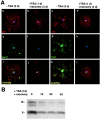
The effect of TSA treatment on morphological differentiation of progenitors is reversible.A, Recovery after TSA washout. Oligodendrocyte progenitors were allowed to differentiate in the absence of TSA by withdrawal of mitogen from the medium for either 3 d (a, e, i) or 5 d (c, g, k). The TSA-treated group was exposed to 10 ng/ml TSA during the first 24 hr of mitogen withdrawal and then allowed to recover for an additional 2 d (b, f, j) or 4 d (d, h, l) in the absence of the drug. Cells cultured for 3 d (a–j) were stained with antibodies against O4 (red) and GalC (green), whereas the nuclei were identified using DAPI (blue). Cells cultured for 5 d were stained with antibodies against O4 (red) and PLP (green). Note that the alterations of the cell morphology induced by TSA were completely reversible, whereas the expression of myelin-specific genes was weaker in cells treated with TSA during the first 24 hr of mitogen withdrawal. Scale bar, 20 μm.B, Recovery of deacetylation after TSA washout. Western blot analysis of protein lysates obtained from cells treated for 1 d with 10 ng/ml TSA (0) and from cells allowed to recover in the absence of TSA for 1 d (1d), 2 d (2d), or 3 d (3d). Note that, after removal of the HDAC inhibitor from the medium, deacetylation occurs quite rapidly, and this correlates with the recovery of branching.
Fig. 10.
Fig. 10.
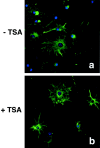
Inhibition of histone deacetylase activity does not prevent differentiation of cortical progenitors into type IIA astrocytes. Rat cortical progenitors were differentiated into type II astrocytes cultured in medium supplemented with 20% FCS in the absence (a) or presence (b) of TSA and then stained for glial fibrillary acidic protein (green fluorescence). No difference was observed in either morphology or GFAP expression between treated and untreated cells.
Fig. 11.
Fig. 11.
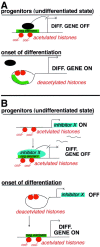
A proposed model of the role of histone deacetylation in oligodendrocyte differentiation. A, Direct model. The first model assumes that histone deacetylation occurs directly in the promoter of specific differentiation genes (e.g., myelin genes). In the presence of mitogens, nucleosomal histones are acetylated on lysine residues (orange circles with COO− tails), and this results in open chromatin conformation and exposure of negative regulatory sites (green rectangles) in the promoter region of myelin genes. Binding of specific regulatory molecules (black ovals) to these sites is favored, and progenitors are kept in an undifferentiated state. On recruitment of HDAC, induced by the withdrawal of mitogens, histone tails are deacetylated (orange circles with no tails), and the chromatin around the negative regulatory sites is compacted, thus preventing the access to transcriptional inhibitors. This event results in onset of differentiation caused by compaction of negativecis-element on the promoter region of myelin genes.B, Indirect model. The second model predicts that histone deacetylation occurs on the promoter of genes encoding for differentiation inhibitors (e.g., gene X). In progenitor cells, nucleosomal histones in the promoter region of the differentiation inhib-itor are acetylated (orange circles with COO− tails), resulting in open chromatin conformation and expression of the inhibitor X. This in turn may bind to negative regulatory sites on differentiation genes and prevent their expression. Onset of differentiation in this case is initiated by recruitment of HDAC to the promoter region, resulting in chromatin compaction and decreased expression of the differentiation inhibitor. According to this model, the negative element on the promoter of differentiation genes may be acetylated but inactive, because of the absence of gene X (left), or deacetylated and compacted (right). In both cases, the expression of differentiation genes is activated by histone deacetylation.

Similar articles

Cited by

References

    1. Ashraf SI, Ip YT. Transcriptional control: repression by local chromatin modification. Curr Biol. 1998;8:R683–R686. - PubMed
    1. Ballas N, Battaglioli E, Atouf F, Andres ME, Chenoweth J, Anderson ME, Burger C, Moniwa M, Davie JR, Bowers WJ, Federoff HJ, Rose DW, Rosenfeld MG, Brehm P, Mandel G. Regulation of neuronal traits by a novel transcriptional complex. Neuron. 2001;31:353–365. - PubMed
    1. Bansal R, Pfeiffer SE. FGF-2 converts mature oligodendrocytes to a novel phenotype. J Neurosci Res. 1997;50:215–228. - PubMed
    1. Bansal R, Warrington AE, Gard AL, Ranscht B, Pfeiffer SE. Multiple and novel specificities of monoclonal antibodies O1, O4, and R-mAb used in the analysis of oligodendrocyte development. J Neurosci Res. 1989;24:548–557. - PubMed
    1. Bansal R, Kumar M, Murray K, Morrison R, Pfeiffer SE. Regulation of FGF receptors in the oligodendrocyte lineage. Mol Cell Neurosci. 1996;7:263–275. - PubMed

Publication types

MeSH terms