. 2002 Dec 1;22(23):10182-91.
doi: 10.1523/JNEUROSCI.22-23-10182.2002.

Activation of muscarinic acetylcholine receptors enhances the release of endogenous cannabinoids in the hippocampus

Affiliations

Activation of muscarinic acetylcholine receptors enhances the release of endogenous cannabinoids in the hippocampus

Jimok Kim et al. J Neurosci. .

Abstract

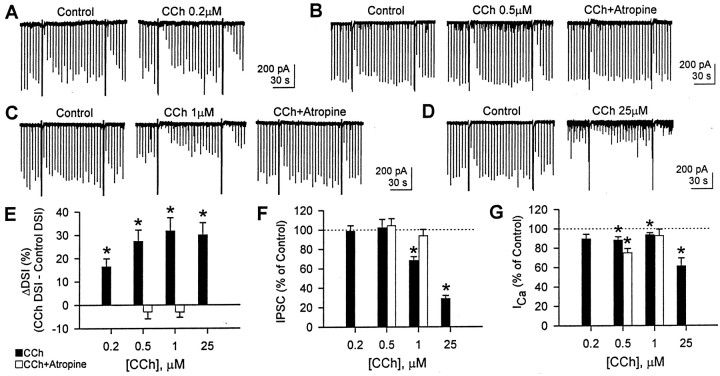
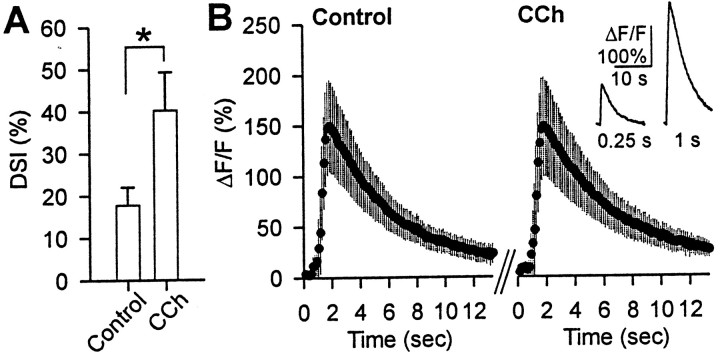
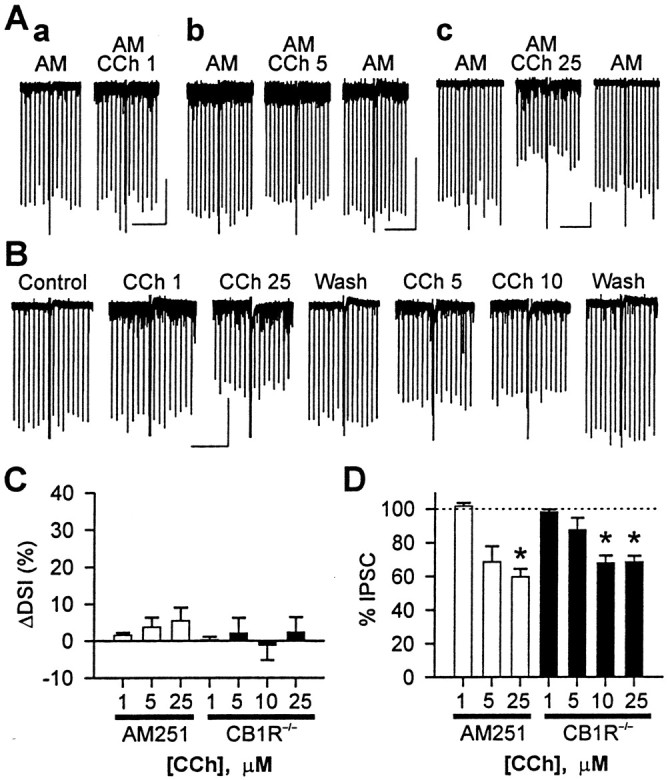
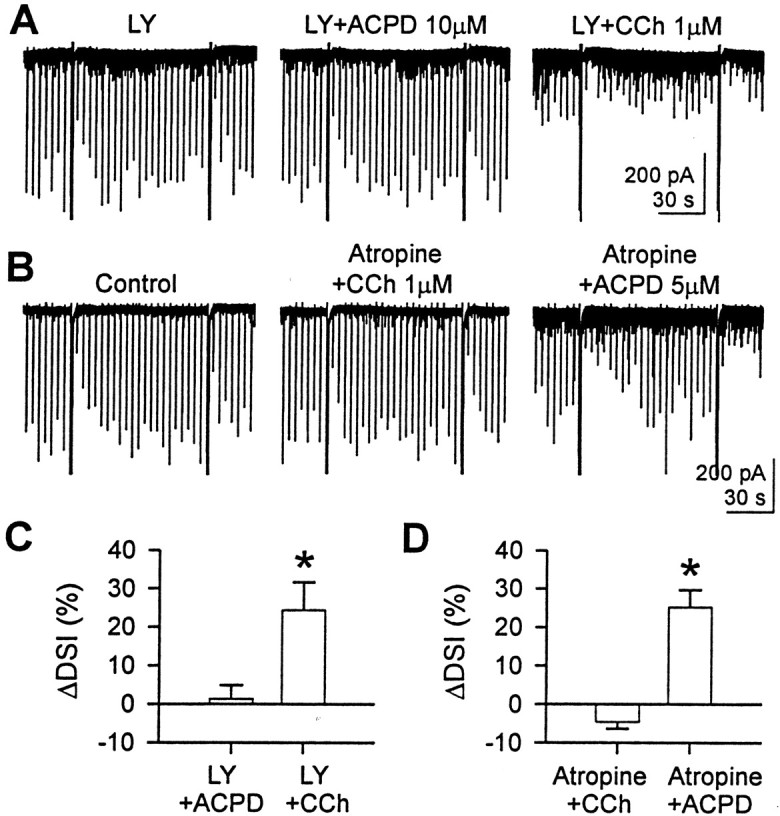
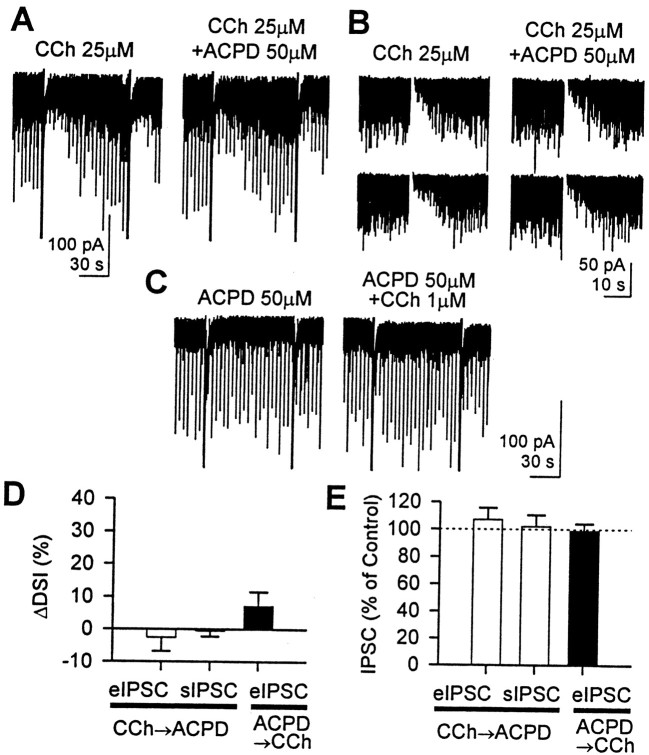
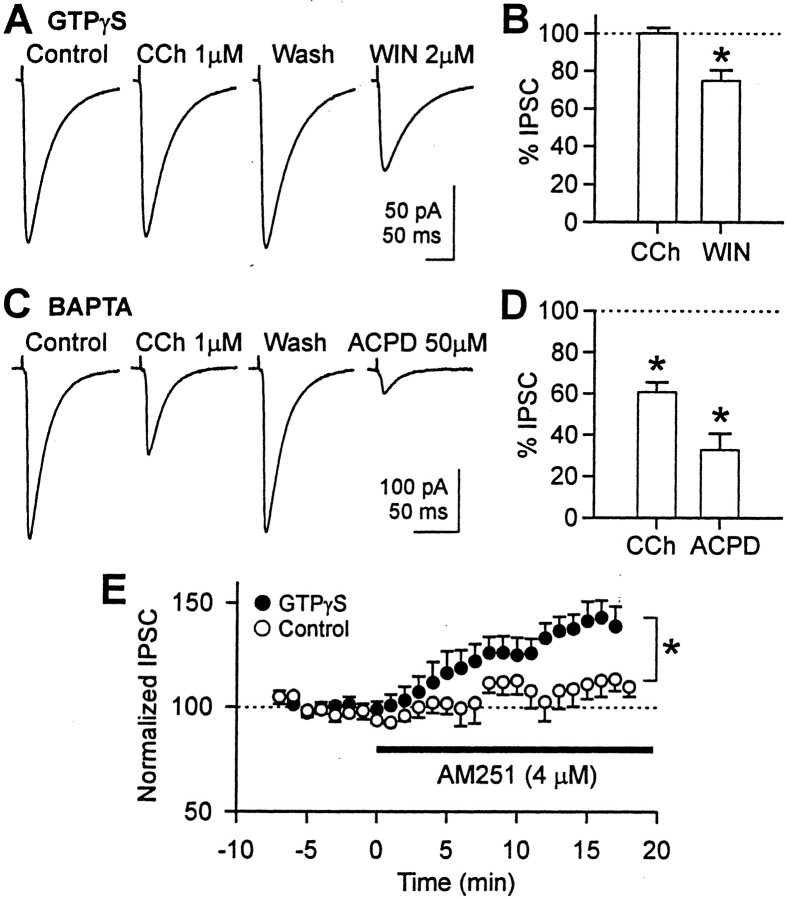
Endogenous cannabinoids (endocannabinoids) are endogenous compounds that resemble the active ingredient of marijuana and activate the cannabinoid receptor in the brain. They mediate retrograde signaling from principal cells to both inhibitory ["depolarization-induced suppression of inhibition" (DSI)] and excitatory ("depolarization-induced suppression of excitation") afferent fibers. Transient endocannabinoid release is triggered by voltage-dependent Ca(2+) influx and is upregulated by group I metabotropic glutamate receptor activation. Here we show that muscarinic acetylcholine receptor (mAChR) activation also enhances transient endocannabinoid release (DSI) and induces persistent release. Inhibitory synapses in the rat hippocampal CA1 region of acute slices were studied using whole-cell patch-clamp techniques. We found that low concentrations (0.2-0.5 microm) of carbachol (CCh) enhanced DSI without affecting basal evoked IPSCs (eIPSCs) by activating mAChRs on postsynaptic cells. Higher concentrations of CCh (> or =1 microm) enhanced DSI and also persistently depressed basal eIPSCs, mainly by releasing endocannabinoids. Persistent CCh-induced endocannabinoid release did not require an increase in [Ca2+]i but was dependent on G-proteins. Although they were independent at the receptor level, muscarinic and glutamatergic mechanisms of endocannabinoid release shared intracellular machinery. Replication of the effects of CCh by blocking acetylcholinesterase with eserine suggests that mAChR-mediated endocannabinoid release is physiologically relevant. This study reveals a new role of the muscarinic cholinergic system in mammalian brain.


Figures

Fig. 1.
Fig. 1.
CCh enhances DSI and depresses eIPSC amplitudes. eIPSCs were evoked every 4 sec, and cells were depolarized to 0 mV from the holding potential of −70 mV every 88 sec. A–D, Representative traces from four different cells. Two DSI trials per condition are shown. CCh enhanced DSI at 0.2–25 μm and reduced eIPSC amplitude as well at ≥1 μm. The antagonistic effect of atropine (1 μm) was tested with 0.5 and 1 μm CCh. E, Changes in DSI (ΔDSI) were calculated by subtracting control DSI from DSI with CCh (filled bars). DSI with CCh was greater than control DSI at 0.2, 0.5, 1, and 25 μmCCh (n = 7, 7, 11, and 5, respectively) (*p < 0.01; paired t test). At 0.5 μm (n = 5) and 1 μm(n = 5) CCh, 1 μm atropine reversed the effect of CCh (open bars; paired ttest after repeated measures ANOVA; p > 0.1).F, eIPSC amplitude was not changed by 0.2 and 0.5 μm CCh (paired t test;p > 0.1) but reduced by 1 and 25 μm(*p < 0.001; paired t test;filled bars). Atropine (1 μm) recovered the eIPSC amplitude reduced by 1 μm CCh (open bars; paired t test after repeated measures ANOVA; p > 0.1). G, Peak Ca2+ current activated by 0 mV pulse. In the presence of 0.2–1 μm CCh, the mean Ca2+ currents were 88–94% of control (filled bars). In the presence of 0.5 μm CCh plus atropine, the Ca2+ current showed more rundown (75 ± 4% of control; open bars). CCh (25 μm) reduced the eIPSC amplitude to 61 ± 8% of control. *p < 0.05; pairedt test between control and CCh.
Fig. 2.
Fig. 2.
The enhancement of DSI by CCh is not associated with an increase in the depolarization-induced somatic Ca2+ transients. eIPSCs were evoked every 5 sec, and a 250-msec-long depolarizing voltage step to 0 mV was delivered at intervals of several minutes. A, The average magnitude of DSI in control solution was enhanced more than twofold in 0.2 μm CCh (*p < 0.05; Wilcoxon signed rank test; n = 5). B, Group data for the simultaneously measured ΔF/F ratio of the [Ca2+]i signals are shown for control conditions (left graph) and in the same cells in the presence of CCh (right graph). The DSI-inducing voltage step was given 1.5 sec after time 0. Note that the increase in DSI is not accompanied by an increase in ΔF/F. The inset on theright graph, showing an example of a larger ΔF/F change that was produced by a 1 sec voltage step in the same cells, demonstrates that the lack of measured changes in ΔF/F did not result from dye saturation.
Fig. 3.
Fig. 3.
The effects of CCh on DSI and eIPSCs are reduced by AM251 and in CB1R−/− mice. A, Representative traces from three cells in rat slices treated with the CB1R antagonist AM251 (4 μm). One DSI trial per condition is shown. DSI was abolished by AM251, and CCh (1–25 μm) did not produce notable DSI. eIPSC amplitude was not changed by 1 μm CCh (a) but was reduced by 5 μm (b) or 25 μm CCh (c). Calibration: 200 pA, 30 sec.B, Representative traces of a cell from a CB1R−/− mouse. One DSI trial per condition is shown. DSI is absent in the presence or absence of CCh. eIPSCs were reduced by 5–25 μm CCh. Calibration: 200 pA, 30 sec.C, DSI was not changed significantly by 1–25 μm CCh in the presence of 4 μm AM251 (open bars) or in CB1R−/− mice (filled bars). In AM251 data,n = 5 for 1 or 25 μm CCh, andn = 4 for 5 μm CCh. For each concentration of CCh in AM251 data, p > 0.1 (paired t tests). In CB1R−/− data,n = 4, and p > 0.1 (repeated measures ANOVA). D, eIPSC amplitude was not changed by 1 μm CCh in rat slices with AM251 (open bar;p > 0.1; paired t test) or in slices from CB1R−/− mice (filled bar; p > 0.1; paired t test after repeated measures ANOVA). The effects of 5 μm CCh on eIPSC amplitude were variable from cell to cell and were not significant (p > 0.1; same tests as 1 μm). eIPSC was significantly reduced by 25 μm CCh (p < 0.05; same tests as 1 μm).
Fig. 4.
Fig. 4.
Activation of mAChR or mGluR can enhance DSI independently of each other. A, In the presence of LY341495 (100 μm), 1 μm CCh enhanced DSI and reduced the eIPSC amplitude, but the ability of 10 μmACPD to enhance DSI was antagonized by 100 μm LY341495.Traces are from one cell. B, In the presence of atropine (1 μm), 5 μm ACPD enhanced DSI, but 1 μm CCh did not. C, In five cells, ACPD (10 μm) and CCh (1 μm) were sequentially applied in the presence of 100 μmLY341495. CCh enhanced DSI significantly (*p < 0.05; paired t test after repeated measures ANOVA). No effect of ACPD (paired t test after repeated measures ANOVA; p > 0.5) indicates that LY341495 was effectively blocking mGluR. D, In five cells, CCh (0.5 or 1 μm) and ACPD (5 or 10 μm) were sequentially applied in the presence of 1 μm atropine. Data for two concentrations were pooled. ACPD enhanced DSI significantly (*p < 0.05; paired ttest after repeated measures ANOVA), whereas CCh did not (pairedt test after repeated measures ANOVA;p > 0.5 ).
Fig. 5.
Fig. 5.
A high concentration of either CCh or ACPD prevented the other from enhancing DSI and reducing eIPSC amplitude.A, ACPD (50 μm), which normally reduces eIPSC amplitude and occludes DSI at this concentration, did not affect DSI or eIPSC when applied with 25 μm CCh. Note that 50 μm ACPD had little effect on either eIPSC or sIPSC.B, In this cell, only sIPSCs were measured. DSI and eIPSC amplitudes were unaffected by 50 μm ACPD in the presence of 25 μm CCh. Ca2+ current and associated transient current were blanked for clarity. For clear comparison of DSI, a fast inward current activated by depolarization was subtracted from the baseline. The two DSI trials in each column are consecutive. C, In this cell, 50 μm ACPD was applied before 1 μm CCh. CCh slightly enhanced DSI but had no effect on eIPSC amplitude. D, Group data of ΔDSI. When 25 μm CCh was applied first (open bars), 50 μm ACPD had no effect on DSI of eIPSC (n = 5; paired t test;p > 0.5) or DSI of sIPSC (n = 7; paired t test; p > 0.5). When 50 μm ACPD was applied first (filled bar), 1 μm CCh slightly increased DSI of eIPSC, but it was not significant (n = 5; pairedt test; p > 0.1). In the experiments in which CCh was applied first, both sIPSC and eIPSC were measured in four cells, only sIPSC was measured in three cells, and only eIPSC was measured in one cell. E, When 25 μm CCh was applied first (open bars), 50 μm ACPD had no effect on amplitude of eIPSC (n = 5; paired t test;p > 0.1) or charge of sIPSC (n= 7; paired t test; p > 0.5). When 50 μm ACPD was applied first (filled bar), 1 μm CCh did not change the amplitude of eIPSC (n = 5; paired t test;p > 0.1). Charge carried by sIPSC was measured by integrating the area under sIPSC for 20 sec before and 16 sec after the 0 mV pulse. “Charge per second” was used as a magnitude of sIPSC.
Fig. 6.
Fig. 6.
Effect of CCh on eIPSC amplitude in cells loaded with GTPγS (1 mm) or high BAPTA (35 mm).A, With 1 mm GTPγS inside the postsynaptic cell, CCh (1 μm) did not reduce eIPSC amplitude, but WIN 55212-2 (2 μm) did. In all experiments, WIN 55212-2 was applied in the absence of CCh to prevent confounding of effects. Forty traces were averaged for this cell, and 30–60 traces were averaged for other cells. The stimulus artifacts were partially truncated graphically. We waited for ∼30 min for complete action of GTPγS. DSI had disappeared by this time because of inhibition of the Ca2+ current. B, With 1 mm intracellular GTPγS, 1 μm CCh did not affect eIPSC amplitude (n = 6; pairedt test; p > 0.1), but WIN55212-2 (2 μm) reduced it to 75 ± 6% (n = 5; paired t test; *p < 0.05).C, CCh (1 μm) reduced eIPSC amplitude in a reversible manner in the presence of 35 mm BAPTA inside the postsynaptic cell. In addition, high BAPTA did not prevent 50 μm ACPD from reducing eIPSC. Forty to 50 traces were averaged for this cell, and 40–60 traces were averaged for other cells. DSI was not observed with high BAPTA in either the presence or absence of CCh. D, In cells loaded with 35 mm BAPTA, 1 μm CCh reduced eIPSC amplitude to 61 ± 5% (n = 6; paired ttest; *p < 0.01), and 50 μm ACPD reduced it to 33 ± 8% (n = 5; pairedt test; *p < 0.05).E, In cells loaded with 1 mm GTPγS, AM251 (4 μm) increased eIPSC amplitude (filled circles; n = 5), indicating that GTPγS by itself stimulated endocannabinoid release. At 16 min of AM251 application, eIPSC amplitude was 143 ± 8% of the control amplitude. AM251 was also applied to control cells lacking GTPγS (open circles; n = 5). At 16 min, eIPSC amplitude in these cells was 113 ± 8% of the baseline. Each circle is mean value of five cells after averaging 15 traces (1 min) within a cell. *p < 0.05;t test for 16–17 min.
Fig. 7.
Fig. 7.
Eserine, the ACh esterase inhibitor, enhanced DSI.A, Sample traces showing that eserine (2 μm) enhanced DSI and reduced eIPSC. Both effects were reversed by 1 μm atropine. B, Group data (n = 5 cells) for the effects of eserine and atropine. a, DSI was significantly increased (ΔDSI = 23 ± 4%) by eserine (*p < 0.01; paired t test after repeated measures ANOVA).Filled bar, Eserine; open bar, eserine and atropine. b, eIPSC amplitude was significantly reduced by eserine to 85 ± 3% of control (*p< 0.05; paired t test after repeated measures ANOVA).c, Peak Ca2+ current, however, was not affected by 2 μm eserine (p > 0.1; repeated measures ANOVA).C, AM251 (4 μm) abolished the effects of eserine, indicating that the effects of eserine were mediated via CB1R.D, Group data (n = 5 cells) showing that AM251 blocked the enhancement of DSI (a) (p > 0.1; paired t test) and reduction of eIPSC amplitudes (b) (p > 0.1; paired t test) caused by eserine.

Similar articles

Cited by

References

    1. Adams PR, Brown DA, Constanti A. Pharmacological inhibition of the M-current. J Physiol (Lond) 1982;332:223–262. - PMC - PubMed
    1. Alger BE, Pitler TA. Retrograde signaling at GABAA-receptor synapses in the mammalian CNS. Trends Neurosci. 1995;18:333–340. - PubMed
    1. Ameri A. The effects of cannabinoids on the brain. Prog Neurobiol. 1999;58:315–348. - PubMed
    1. Andrade R, Malenka RC, Nicoll RA. A G protein couples serotonin and GABAB receptors to the same channels in hippocampus. Science. 1986;234:1261–1265. - PubMed
    1. Beech DJ, Bernheim L, Mathie A, Hille B. Intracellular Ca2+ buffers disrupt muscarinic suppression of Ca2+ current and M current in rat sympathetic neurons. Proc Natl Acad Sci USA. 1991;88:652–656. - PMC - PubMed

Publication types

MeSH terms

LinkOut - more resources