Opposing roles of STAT1 and STAT3 in T cell-mediated hepatitis: regulation by SOCS
- PMID: 12438448
- PMCID: PMC151811
- DOI: 10.1172/JCI15841
Opposing roles of STAT1 and STAT3 in T cell-mediated hepatitis: regulation by SOCS
Abstract
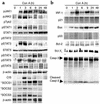
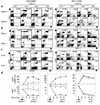
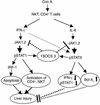
T cell-mediated fulminant hepatitis is a life-threatening event for which the underlying mechanism is not fully understood. Injection of concanavalin A (Con A) into mice recapitulates the histological and pathological sequelae of T cell-mediated hepatitis. In this model, both signal transducer and activator of transcription factor 1 (STAT1) and STAT3 are activated in the liver. Disruption of the STAT1 gene by way of genetic knockout attenuates liver injury, suppresses CD4(+) and NK T cell activation, and downregulates expression of proapoptotic interferon regulatory factor-1 protein and suppressor of cytokine signaling-1 (SOCS1), but enhances STAT3 activation and STAT3-controlled antiapoptotic signals. Studies from IFN-gamma-deficient mice indicate that IFN-gamma not only is the major cytokine responsible for STAT1 activation but also partially accounts for STAT3 activation. Moreover, downregulation of STAT3 activation in IL-6-deficient mice is associated with decreased STAT3-controlled antiapoptotic signals and expression of SOCS3, but upregulation of STAT1 activation and STAT1-induced proapoptotic signals and exacerbation of liver injury. Taken together, these findings suggest that STAT1 plays a harmful role in Con A-mediated hepatitis by activation of CD4(+) and NK T cells and directly inducing hepatocyte death, whereas STAT3 protects against liver injury by suppression of IFN-gamma signaling and induction of antiapoptotic protein Bcl-X(L). STAT1 and STAT3 in hepatocytes also negatively regulate one another through the induction of SOCS.
Figures


Similar articles
-
Interferon-gamma inhibits interferon-alpha signalling in hepatic cells: evidence for the involvement of STAT1 induction and hyperexpression of STAT1 in chronic hepatitis C.Biochem J. 2004 Apr 1;379(Pt 1):199-208. doi: 10.1042/BJ20031495. Biochem J. 2004. PMID: 14690454 Free PMC article.
-
Thyrotropin induces SOCS-1 (suppressor of cytokine signaling-1) and SOCS-3 in FRTL-5 thyroid cells.Mol Endocrinol. 2000 Mar;14(3):440-8. doi: 10.1210/mend.14.3.0433. Mol Endocrinol. 2000. PMID: 10707961
-
Loss of interferon-induced Stat1 phosphorylation in activated T cells.J Interferon Cytokine Res. 2004 Mar;24(3):169-78. doi: 10.1089/jir.2004.24.169. J Interferon Cytokine Res. 2004. PMID: 15035850
-
[Induction of SOCS family proteins in inflammatory diseases and suppression of inflammatory arthritis model by the adenovirus gene transfer].Tanpakushitsu Kakusan Koso. 2002 Dec;47(16 Suppl):2355-61. Tanpakushitsu Kakusan Koso. 2002. PMID: 12518461 Review. Japanese. No abstract available.
-
SOCS proteins: negative regulators of cytokine signaling.Stem Cells. 2001;19(5):378-87. doi: 10.1634/stemcells.19-5-378. Stem Cells. 2001. PMID: 11553846 Review.
Cited by
-
New and recurrent gain-of-function STAT1 mutations in patients with chronic mucocutaneous candidiasis from Eastern and Central Europe.J Med Genet. 2013 Sep;50(9):567-78. doi: 10.1136/jmedgenet-2013-101570. Epub 2013 May 24. J Med Genet. 2013. PMID: 23709754 Free PMC article.
-
Tumour necrosis factor alpha (TNF)-TNF receptor 1-inducible cytoprotective proteins in the mouse liver: relevance of suppressors of cytokine signalling.Biochem J. 2005 Jan 15;385(Pt 2):537-44. doi: 10.1042/BJ20040279. Biochem J. 2005. PMID: 15554901 Free PMC article.
-
The Fgl2/fibroleukin prothrombinase contributes to immunologically mediated thrombosis in experimental and human viral hepatitis.J Clin Invest. 2003 Jul;112(1):58-66. doi: 10.1172/JCI18114. J Clin Invest. 2003. PMID: 12840059 Free PMC article.
-
Pathophysiological Changes During Ischemia-reperfusion Injury in Rodent Hepatic Steatosis.In Vivo. 2020 May-Jun;34(3):953-964. doi: 10.21873/invivo.11863. In Vivo. 2020. PMID: 32354880 Free PMC article. Review.
-
In vivo consequences of liver-specific interleukin-22 expression in mice: Implications for human liver disease progression.Hepatology. 2011 Jul;54(1):252-61. doi: 10.1002/hep.24339. Hepatology. 2011. PMID: 21465510 Free PMC article.
References
-
- Kita H, Mackay IR, Van De Water J, Gershwin ME. The lymphoid liver: considerations on pathways to autoimmune injury. Gastroenterology. 2001;120:1485–1501. - PubMed
-
- Heneghan MA, McFarlane IG. Current and novel immunosuppressive therapy for autoimmune hepatitis. Hepatology. 2002;35:7–13. - PubMed
-
- Bogdanos DP, Mieli-Vergani G, Vergani D. Virus, liver and autoimmunity. Dig Liver Dis. 2000;32:440–446. - PubMed
-
- Rehermann B, Chisari FV. Cell-mediated immune response to the hepatitis C virus. Curr Top Microbiol Immunol. 2000;242:299–325. - PubMed
-
- Chedid A, et al. Cell-mediated hepatic injury in alcoholic liver disease. Veterans Affairs Cooperative Study Group 275. Gastroenterology. 1993;105:254–266. - PubMed
MeSH terms
Substances
LinkOut - more resources
Full Text Sources
Other Literature Sources
Molecular Biology Databases
Research Materials
Miscellaneous

