. 2002 Nov;76(22):11659-76.
doi: 10.1128/jvi.76.22.11659-11676.2002.

Both mucosal and systemic routes of immunization with the live, attenuated NYVAC/simian immunodeficiency virus SIV(gpe) recombinant vaccine result in gag-specific CD8(+) T-cell responses in mucosal tissues of macaques

Affiliations

Both mucosal and systemic routes of immunization with the live, attenuated NYVAC/simian immunodeficiency virus SIV(gpe) recombinant vaccine result in gag-specific CD8(+) T-cell responses in mucosal tissues of macaques

Liljana Stevceva et al. J Virol. 2002 Nov.

Abstract

As most human immunodeficiency virus (HIV) infection occurs via mucosal surfaces, an important goal of vaccination may be the induction of virus-specific immune responses at mucosal sites to contain viral infection early on. Here we designed a study in macaques carrying the major histocompatibility complex class I Mamu-A(*)01 molecule to assess the capacity of the highly attenuated poxvirus NYVAC/simian immunodeficiency virus (SIV) SIV(gpe) vaccine candidate administered by the intranasal, intramuscular, or intrarectal route to induce mucosal immunity. All macaques, including one naive macaque, were exposed to SIV(mac251) by the intrarectal route and sacrificed 48 h after infection. The kinetics of immune response at various time points following immunization with NYVAC/SIV(gpe) and the anamnestic response to SIV(mac251) at 48 h after challenge were assessed in blood, in serial rectal and vaginal biopsy samples, and in tissues at euthanasia with an SIV(mac) Gag-specific tetramer. In addition, at euthanasia, antigen-specific cells producing gamma interferon or tumor necrosis factor alpha from the jejunum lamina propria were quantified in all macaques. Surprisingly, antigen-specific CD8(+) T cells were found in the mucosal tissues of all immunized macaques regardless of whether the vaccine was administered by a mucosal route (intranasal or intrarectal) or systemically. In addition, following mucosal SIV(mac251) challenge, antigen-specific responses were mainly confined to mucosal tissues, again regardless of the route of immunization. We conclude that immunization with a live vector vaccine results in the appearance of CD8(+) T-cell responses at mucosal sites even when the vaccine is delivered by nonmucosal routes.


Figures

FIG. 1.
FIG. 1.
Control staining for tetramers. Staining of isolated lamina propria lymphocytes from vaginal and rectal biopsy samples obtained from infected Mamu-A∗01-negative and naive Mamu-A∗01-positive macaques and macaque 654 before viral challenge, and staining with unrelated tetramer on isolated vaginal and rectal lamina propria lymphocytes from immunized, infected Mamu-A∗01-positive macaques (a) was used to control for the specificity of the staining. Nonspecific binding accounted for up to 0.13% of the CD3+ CD8+ lymphocytes. Therefore, values above this percentage could be considered positive. Tetramer staining of peripheral blood mononuclear cells (PBMCs) isolated prior to immunization was negative in the five macaques examined (b).
FIG. 1.
FIG. 1.
Control staining for tetramers. Staining of isolated lamina propria lymphocytes from vaginal and rectal biopsy samples obtained from infected Mamu-A∗01-negative and naive Mamu-A∗01-positive macaques and macaque 654 before viral challenge, and staining with unrelated tetramer on isolated vaginal and rectal lamina propria lymphocytes from immunized, infected Mamu-A∗01-positive macaques (a) was used to control for the specificity of the staining. Nonspecific binding accounted for up to 0.13% of the CD3+ CD8+ lymphocytes. Therefore, values above this percentage could be considered positive. Tetramer staining of peripheral blood mononuclear cells (PBMCs) isolated prior to immunization was negative in the five macaques examined (b).
FIG. 2.
FIG. 2.
Gating of tissue lymphocytes for flow cytometry analysis. Extending the lymphocyte gate to include larger cells revealed a population of CD3+ CD8+ tetramer-positive cells that was concealed when the conventional lymphocyte gate was used.
FIG. 3.
FIG. 3.
Tetramer staining during immunization. Immune responses during the immunization procedure were assessed by measuring the percentage of CD3+ CD8+ Gag181-189 CM9-positive cells in blood (upper graphs in panels a, b, c, and d; arrows indicate time of immunization) and in isolated lymphocytes from rectal and vaginal biopsy samples (flow charts in panels a, b, c, and d). Cells were gated through the CD3+ CD8+ gate, and the percentage of Gag181-189 CM9-positive cells was determined by histogram analysis. The flow charts are shown here as dot blots rather than histograms in order to better demonstrate the population of cells. An equal number of CD3+ CD8+ cells (104) was acquired for each sample analyzed. Samples in which fewer than 5 × 10³ CD3+ CD8+ cells were acquired are indicated (∗). Times of immunization are indicated on the graphs with arrows. (a) Findings in intrarectally (I.R.) immunized macaques 814 and 818 shown as a graph for blood and as flow charts for biopsy samples underneath the graph. (b) Findings in intranasally (I.N.) immunized animals 816 and 582. (c) Findings in intramuscularly (I.M.) immunized macaque 815. (d) Findings in intramuscularly immunized macaque 536. LP, lamina propria.
FIG. 3.
FIG. 3.
Tetramer staining during immunization. Immune responses during the immunization procedure were assessed by measuring the percentage of CD3+ CD8+ Gag181-189 CM9-positive cells in blood (upper graphs in panels a, b, c, and d; arrows indicate time of immunization) and in isolated lymphocytes from rectal and vaginal biopsy samples (flow charts in panels a, b, c, and d). Cells were gated through the CD3+ CD8+ gate, and the percentage of Gag181-189 CM9-positive cells was determined by histogram analysis. The flow charts are shown here as dot blots rather than histograms in order to better demonstrate the population of cells. An equal number of CD3+ CD8+ cells (104) was acquired for each sample analyzed. Samples in which fewer than 5 × 10³ CD3+ CD8+ cells were acquired are indicated (∗). Times of immunization are indicated on the graphs with arrows. (a) Findings in intrarectally (I.R.) immunized macaques 814 and 818 shown as a graph for blood and as flow charts for biopsy samples underneath the graph. (b) Findings in intranasally (I.N.) immunized animals 816 and 582. (c) Findings in intramuscularly (I.M.) immunized macaque 815. (d) Findings in intramuscularly immunized macaque 536. LP, lamina propria.
FIG. 4.
FIG. 4.
In situ tetramer staining. Double immunofluorescent staining and image analysis were initially done on positive samples from cultured spleen cells and from lymph nodes taken from a known Gag181-189 CM9-positive animal (a). In immunized macaques, positive staining is shown in the colonic tissue from animal 816 2 weeks after the boost (b). Images for individual channels (CD3, green; SIV-Gag tetramer, red; differential interference contrast, gray scale) are shown on the left side, and a larger merged image containing all three channels is shown on the right (b). Several CD3+ cells are present, and one is also labeled with the SIV-Gag tetramer. Bar, 10 μm (b). FITC, fluorescein isothiocyanate; CY3, indocarbocyanine.
FIG. 4.
FIG. 4.
In situ tetramer staining. Double immunofluorescent staining and image analysis were initially done on positive samples from cultured spleen cells and from lymph nodes taken from a known Gag181-189 CM9-positive animal (a). In immunized macaques, positive staining is shown in the colonic tissue from animal 816 2 weeks after the boost (b). Images for individual channels (CD3, green; SIV-Gag tetramer, red; differential interference contrast, gray scale) are shown on the left side, and a larger merged image containing all three channels is shown on the right (b). Several CD3+ cells are present, and one is also labeled with the SIV-Gag tetramer. Bar, 10 μm (b). FITC, fluorescein isothiocyanate; CY3, indocarbocyanine.
FIG. 5.
FIG. 5.
Tetramer staining after challenge. Macaques were challenged with SIVmac251 and sacrificed 48 h later. SIV-specific cells were determined as a percentage of Gag181-189 CM9-positive cells of the CD3+ CD8+ population in lymphocytes isolated from each tissue. An equal number of CD3+ CD8+ cells (104) was acquired for each sample analyzed. SIV-specific responses in intramuscularly (I.M.) immunized macaques 536 and 815 (a) are shown as a graph (∗, not done). Samples of blood lymphocytes at the time of necropsy and highly positive mucosal tissue samples are shown as flowcharts beneath the graph for each macaque. Tetramer-positive cells in intranasally (I.N.) immunized animals 816 and 582 (only 1.152 × 10³ CD3+ CD8+ cervical lamina propria cells were analyzed for animal 582) (b) and in intrarectally (I.R.) immunized macaques 818 and 814 (c) are shown. Animal 654, which was not immunized but was challenged, is shown (d). LP, lamina propria; LN, lymph node.
FIG. 5.
FIG. 5.
Tetramer staining after challenge. Macaques were challenged with SIVmac251 and sacrificed 48 h later. SIV-specific cells were determined as a percentage of Gag181-189 CM9-positive cells of the CD3+ CD8+ population in lymphocytes isolated from each tissue. An equal number of CD3+ CD8+ cells (104) was acquired for each sample analyzed. SIV-specific responses in intramuscularly (I.M.) immunized macaques 536 and 815 (a) are shown as a graph (∗, not done). Samples of blood lymphocytes at the time of necropsy and highly positive mucosal tissue samples are shown as flowcharts beneath the graph for each macaque. Tetramer-positive cells in intranasally (I.N.) immunized animals 816 and 582 (only 1.152 × 10³ CD3+ CD8+ cervical lamina propria cells were analyzed for animal 582) (b) and in intrarectally (I.R.) immunized macaques 818 and 814 (c) are shown. Animal 654, which was not immunized but was challenged, is shown (d). LP, lamina propria; LN, lymph node.
FIG. 6.
FIG. 6.
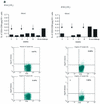
Intracellular cytokine staining. Isolated jejunum lamina propria lymphocytes at necropsy were incubated with or without Gag181-189 CM9 peptide and then stained for expression of IFN-γ and TNF-α. The percentage of CD8+ IFN-γ/TNF-α-positive cells was determined by quadrant analysis as shown on the flow charts. The graphs represent the net population of CD8+ cells stimulated to express these cytokines, i.e., these percentages were derived after the percentage of CD8+ cells spontaneously expressing the cytokines was deducted from the percentage of CD8+ cells expressing them after stimulation with Gag181-189 CM9. The flowcharts show the population of CD8+ IFN-γ/TNF-α-positive cells before and after stimulation in animal 654 (not immunized) and in some of the highest responders. I.R., intrarectal; I.N., intranasal; I.M., intramuscular; APC, allophycocyanin.

Similar articles

Cited by

References

    1. Altman, J. D., P. A. Moss, P. J. Goulder, D. H. Barouch, M. G. McHeyzer-Williams, J. I. Bell, A. J. McMichael, and M. M. Davis. 1996. Phenotypic analysis of antigen-specific T lymphocytes. Science 274:94-96. - PubMed
    1. Arstila, T., T. P. Arstila, S. Calbo, F. Selz, M. Malassis-Seris, P. Vassalli, P. Kourilsky, and D. Guy-Grand. 2000. Identical T-cell clones are located within the mouse gut epithelium and lamina propia and circulate in the thoracic duct lymph. J. Exp. Med. 191:823-834. - PMC - PubMed
    1. Belyakov, I. M., J. D. Ahlers, B. Y. Brandwein, P. Earl, B. L. Kelsall, B. Moss, W. Strober, and J. A. Berzofsky. 1998. The importance of local mucosal HIV-specific CD8+ cytotoxic T lymphocytes for resistance to mucosal viral transmission in mice and enhancement of resistance by local administration of interleukin-12. J. Clin. Investig. 102:2072-2081. - PMC - PubMed
    1. Belyakov, I. M., M. A. Derby, J. D. Ahlers, B. L. Kelsall, P. Earl, B. Moss, W. Strober, and J. A. Berzofsky. 1998. Mucosal immunization with HIV-1 peptide vaccine induces mucosal and systemic cytotoxic T lymphocytes and protective immunity in mice against intrarectal recombinant HIV-vaccinia challenge. Proc. Natl. Acad. Sci. USA 95:1709-1714. - PMC - PubMed
    1. Belyakov, I. M., Z. Hel, B. Kelsall, V. A. Kuznetsov, J. D. Ahlers, J. Nacsa, D. I. Watkins, T. M. Allen, A. Sette, J. Altman, R. Woodward, P. D. Markham, J. D. Clements, G. Franchini, W. Strober, and J. A. Berzofsky. 2001. Mucosal AIDS vaccine reduces disease and viral load in gut reservoir and blood after mucosal infection of macaques. Nat. Med. 7:1320-1326. - PubMed

Publication types

MeSH terms