. 2002 Sep 1;30(17):3818-30.
doi: 10.1093/nar/gkf501.

Characterisation of site-biased DNA methyltransferases: specificity, affinity and subsite relationships

Affiliations

Characterisation of site-biased DNA methyltransferases: specificity, affinity and subsite relationships

Andrew R McNamara et al. Nucleic Acids Res. .

Abstract

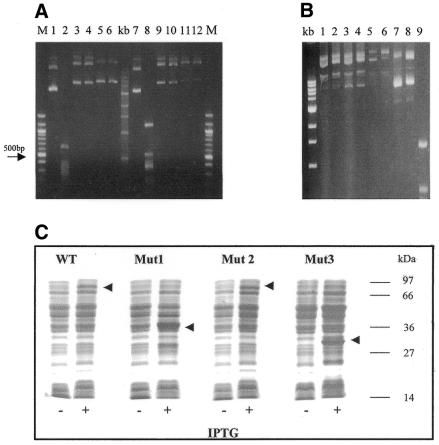
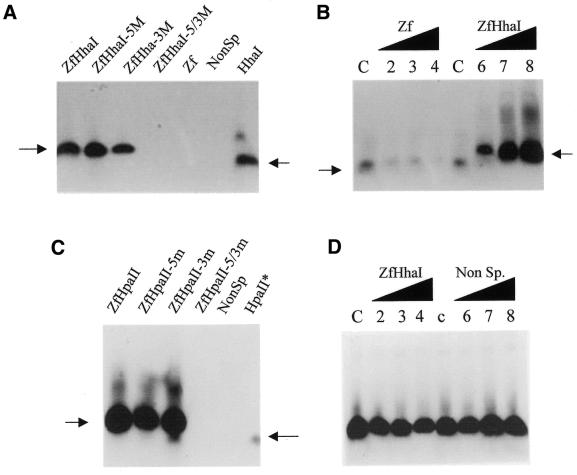
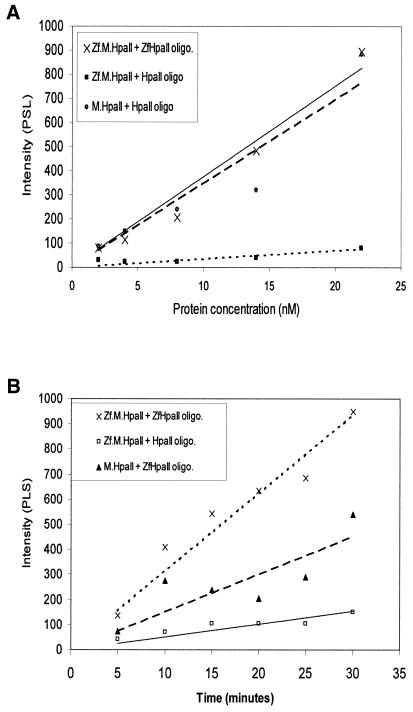
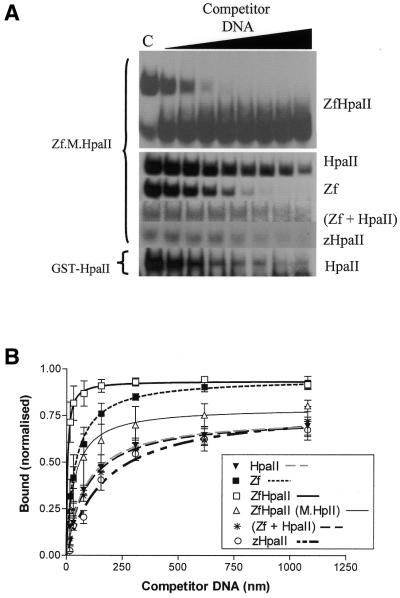
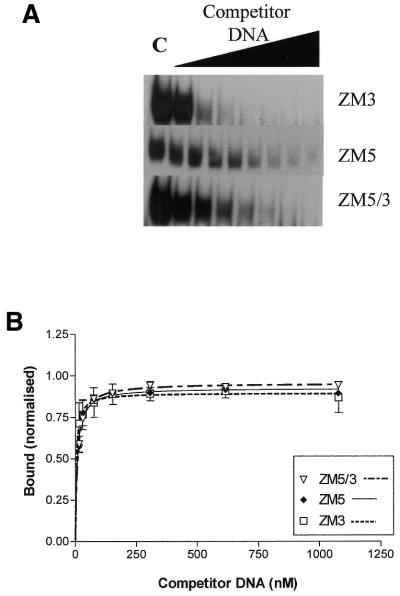
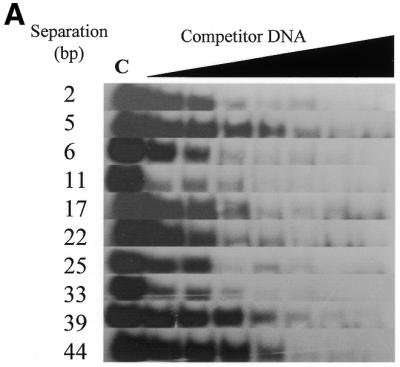
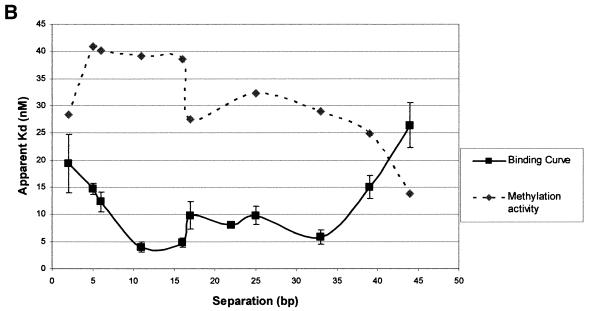
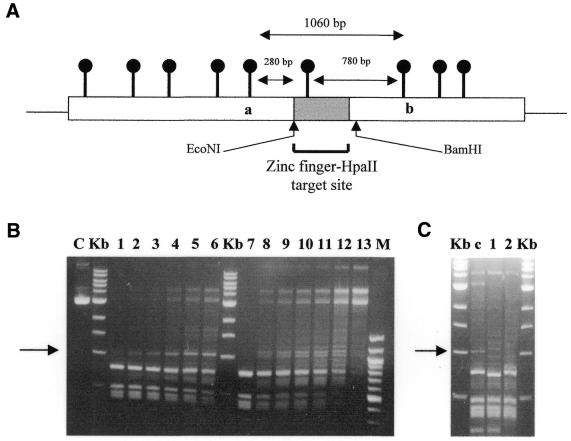
DNA methylation is now seen as a primary signal in the cell for mediating transcriptional repression through chromatin formation. The construction and evaluation of enzymes capable of influencing this process in vivo is therefore of significant interest. We have fused the C5-cytosine DNA methyltransferases, M.HhaI and M.HpaII, which both methylate 4 bp sequences containing a CpG dinucleotide, to a three zinc finger protein recognising a 9 bp DNA sequence. DNA methylation analyses demonstrate specific DNA methylation by both enzymes at target sites comprising adjacent methyltransferase and zinc finger subsites, targeted M.HpaII being the most specific. Binding analysis of the targeted M.HpaII enzyme reveals an 8-fold preference for binding to its target site, compared to binding to a zinc finger site alone, and an 18-fold preference over binding to a methyltransferase site alone, thereby demonstrating enhanced binding by the fusion protein, compared to its component proteins. Both DNA binding and methylation are specific for the target site up to separations of approximately 40 bp between the zinc finger and methyltransferase subsites. Ex vivo plasmid methylation experiments are also described that demonstrate targeted methylation. These targeted enzymes, however, are shown to be not fully mono-functional, retaining a significant non-targeted activity most evident at elevated protein concentrations.


Figures

Figure 1
Figure 1
Restriction protection analysis of in vivo methylated plasmid DNA. (A) Plasmids encoding targeted HhaI and HpaII were isolated from E.coli and subjected to restriction by restriction enzymes HhaI and HpaII respectively, as described in Materials and Methods. Lane 1, uncut control pGEX5X-3 vector; lane 2, R.HhaI restricted pGEX5X-3 vector; lane 3, uncut pGHhaI vector; lane 4, R.HhaI restricted pGHhaI vector; lane 5, uncut pGZfHhaI vector; lane 6, R.HhaI restricted pGZfHhaI vector; lane 7, as lane 1; lane 8, R.HpaII restricted pGEX5X-3 vector; lane 9, uncut pGHpaII vector; lane 10, R.HpaII restricted pGHpaII vector; lane 11, uncut pGZfHpaII vector; lane 12, R.HpaII restricted pGZfHpaII vector; lane m, 100 bp marker (NEB); lane kb, 1 kb ladder (NEB). (B) Plasmids encoding mutant targeted HpaII were isolated from E.coli and subjected to restriction by HpaII. Mutants are: Mut1, wild-type vector cut with EcoRI and filled in to generate HpaII out of frame with GST–Zf; Mut2, wild-type vector with first codon (methionine) of HpaII removed; Mut3, Mut2 vector cut with NdeI and filled in to generate Zf-HpaII out of frame with GST (for details see text). Lanes 1 and 2, uncut and R.HpaII cut wild-type targeted HpaII vector, respectively; lanes 3 and 4, uncut and R.HpaII cut Mut1 vector; lanes 5 and 6, uncut and R.HpaII cut Mut2 vector; lanes 7 and 8, uncut and R.HpaII cut Mut3 vector; lane 9, R.HpaII cut pGEX empty vector. (C) SDS–PAGE analysis of protein induction for wild-type and mutant targeted HpaII enzymes. Molecular weights are indicated on the right of the gel. Induced protein products are arrowed.
Figure 2
Figure 2
Methylation analysis of targeted and non-targeted HhaI and HpaII enzymes. (A) Oligodeoxynucleotide methylation assays were performed to confirm double-strand methylation by Zf.M.HhaI. All reactions contained 1 pmol Zf.M.HhaI protein and 3 pmol duplex DNA as indicated in each lane. Reactions were carried out as described in Materials and Methods. The designations 5M, 3M and 5/3M, in this and other figures, refer to the oligonucleotides being pre-methylated at the target cytosine on either the top, bottom or both DNA strands respectively. (B) Methylation competition assays. All lanes contained 1 pmol Zf.M.HhaI protein and 3 pmol HhaI oligodeoxynucleotide and competitor DNA at the following levels: lane C, no competitor DNA; lanes 2–4, Zf oligodeoxynucleotide added as competitor at 1-, 5- and 10-fold molar excess, respectively; lanes 6–8, ZfHhaI oligodeoxynucleotide added similarly at 1-, 5- and 10-fold molar excess. The arrows indicate the different mobilities of the oligonucleotides used. (C) Oligodeoxynucleotide methylation assays were performed to confirm double-strand methylation by Zf.M.HpaII. All lanes contained 1 pmol Zf.M.HpaII protein and 3 pmol duplex DNA as indicated in each lane. (D) Competition methylation analysis. All reactions contained 1 pmol Zf.M.HpaII, 3 pmol ZfHpaII oligonucleotide and competitor DNA at the following levels: lane c, no competitor DNA; lanes 2–4, as lane c except for the addition of 1-, 5- and 10-fold molar excess of ZfHhaI competitor oligodeoxynucleotide (i.e. effectively zinc finger only site); lanes 6–8, as lane c but with the addition of 1-, 5- and 10-fold molar excess of non-specific (Non-Sp.) oligodeoxynucleotide.
Figure 3
Figure 3
Titrational and time course analysis of targeted and non-targeted HpaII methylation for different oligonucleotide substrates. (A) Increasing concentrations of Zf.M.HpaII and M.HpaII enzyme were incubated with ZfHpaII or HpaII oligonucleotides (final concentration 150 nM) over the concentration range shown. The relative levels of methylated oligonucleotide, as evaluated by phosphorimager analysis, were plotted against protein concentration. The intensity of the tritiated oligonucleotides are plotted as PSL values (photo-stimulated luminescence), which are directly proportional to the radioactivity of the samples being measured. The best fit line for Zf.M.HpaII binding to ZfHpaII oligonucleotide is denoted by a solid line. (B) Time course methylation profile for the interaction of targeted and non-targeted HpaII with oligonucleotide substrates. Reactions contained 20 fmol protein and 3 pmol DNA (for details see Materials and Methods).
Figure 4
Figure 4
(A) Gel shift competition assays. ZfHpaII probe (1.0 nM) was incubated with M.HpaII or Zf.M.HpaII enzymes (1.7 nM) (see Materials and Methods). Lane C, no competitor DNA; subsequent lanes contain competitor DNA at final concentrations of 15.5, 30.8, 77, 154, 308, 616 and 1078 nM. The competitor DNA used is indicated on the right of each gel; the protein assayed in each case is indicated on the left of each gel. For the self-competition experiment, the full retardation gel is shown. For all subsequent experiments, only that portion of the gel containing the retarded probe is shown. (B) Analysis of triplicate binding data described in (A) above.
Figure 5
Figure 5
Gel retardation competition analysis of the interaction of Zf.M.HpaII with pre-methylated target site DNA. (A) ZfHpaII probe was incubated with Zf.M.HpaII enzyme as in Figure 3. Lane C, no competitor DNA; subsequent lanes contain competitor DNA at final concentrations of 15.5, 30.8, 77, 154, 308, 616 and 1078 nM. The competitor DNA used is indicated on the right of each gel. (B) Analysis of triplicate binding data described in (A). Oligonucleotides ZM3, ZM5 and ZM5/3 are identical to oligonucelotide ZfHpaII but contain methylcytosine at the target site (i.e. mCCGG) on the top, bottom and both strands, respectively.
Figure 6
Figure 6
Zf.M.HpaII binds specifically to oligodeoxynucleotides with variable ‘subsite’ spacings. (A) Gel retardation analysis. Lane C in all cases contains Zf.M.HpaII enzyme and ZfHpaII labelled probe at the same levels as shown in Figure 3. Competitor DNA was added to the same final concentrations as given in Figure 3. The base pair separation between subsites for each competitor oligonucleotide is shown to the left of each gel. (B) The apparent Kd values for triplicate competition binding experiments for each subsite spacing were plotted against the subsite spacing. The methylation signal obtained from incubation of each oligonucleotide (30 pmol) with Zf.M.HpaII protein (0.1 pmol) for 30 min in the presence of [3H]AdoMet is also plotted on the same graph. The curve shown is representative of a triplicate set, which all followed the same trend. The methylation intensities have been normalised to fit on the graph.
Figure 6
Figure 6
Zf.M.HpaII binds specifically to oligodeoxynucleotides with variable ‘subsite’ spacings. (A) Gel retardation analysis. Lane C in all cases contains Zf.M.HpaII enzyme and ZfHpaII labelled probe at the same levels as shown in Figure 3. Competitor DNA was added to the same final concentrations as given in Figure 3. The base pair separation between subsites for each competitor oligonucleotide is shown to the left of each gel. (B) The apparent Kd values for triplicate competition binding experiments for each subsite spacing were plotted against the subsite spacing. The methylation signal obtained from incubation of each oligonucleotide (30 pmol) with Zf.M.HpaII protein (0.1 pmol) for 30 min in the presence of [3H]AdoMet is also plotted on the same graph. The curve shown is representative of a triplicate set, which all followed the same trend. The methylation intensities have been normalised to fit on the graph.
Figure 7
Figure 7
Ex vivo methylation analysis of Zf.M.HpaII interacting with target site-containing plasmid DNA. (A) Schematic outline of the key elements of the ZMTopo vector used as substrate in the ex vivo studies described below (see also Materials and Methods). The region of the plasmid harbouring the zinc finger and single flanking HpaII site is shown as a grey box with a lollipop on it. In the scenario where this site has been preferentially methylated (designated by a black lollipop, compared to unmethylated vector HpaII sites, shown in grey), the nearest cleavage by R.HpaII will only occur at flanking HpaII sites a and b, resulting in the generation of a 1060 bp fragment. If this site is not methylated, derivative fragments of ∼280 and 780 bp will be produced. Restriction enzyme sites for EcoNI and BamHI are also shown. These sites are unique to DNA fragments harbouring the target sequence. (B) Target site-containing vector ZMTopo was incubated with increasing amounts of Zf.M.HpaII or M.HpaII enzyme for 30 min prior to digestion with R.HpaII. Lanes 1–6 and 7–12 represent digestion of vector preincubated with 25, 50, 75, 125, 175 and 225 fmol Zf.M.HpaII and M.HpaII protein, respectively. The expected 1060 bp DNA fragment indicative of targeted methylation is arrowed. Lane U, unrestricted ZMTopo DNA; lane C, unmethylated vector DNA restricted with R.HpaII; lane M, 100 bp ladder (NEB). Key size bands are indicated. (C) All lanes were identical to those described for lane 4 in (B), but with the inclusion of 10 U of the restriction enzyme EcoNI (lane 1) or BamHI (lane 2) or just water (lane c). The 1060 bp DNA fragment present in lane c is arrowed.

Similar articles

Cited by

References

    1. Posfai J., Bhagwat,A.S., Posfai,G. and Roberts,R.J. (1989) Predictive motifs derived from cytosine methyltransferases. Nucleic Acids Res., 17, 2421–2435. - PMC - PubMed
    1. Wilson G. (1992) Amino acid sequence arrangements of DNA-methyltransferases. Methods Enzymol., 216, 259–278. - PubMed
    1. Klimasauskas S., Kumar,S., Roberts,R.J. and Cheng,X. (1994) HhaI methyltransferase flips its target base out of the DNA helix. Cell, 76, 357–369. - PubMed
    1. Reinisch K.M., Chen,L., Verdine,G.L. and Lipscomb,W.N. (1995) The crystal structure of HaeIII methyltransferase covalently complexed to DNA: an extrahelical cytosine and rearranged base pairing. Cell, 82, 143–153. - PubMed
    1. Xu G.-L. and Bestor,T.H. (1997) Cytosine methylation targetted to predetermined sequences. Nature Genet., 17, 376–378. - PubMed

Publication types