

Imaging cells and extracellular matrix in vivo by using second-harmonic generation and two-photon excited fluorescence
- PMID: 12177437
- PMCID: PMC123202
- DOI: 10.1073/pnas.172368799
Imaging cells and extracellular matrix in vivo by using second-harmonic generation and two-photon excited fluorescence
Abstract
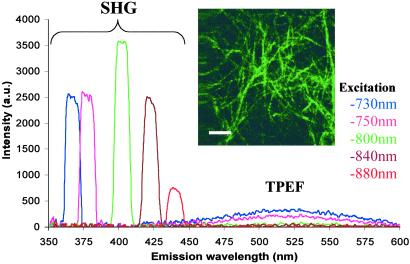
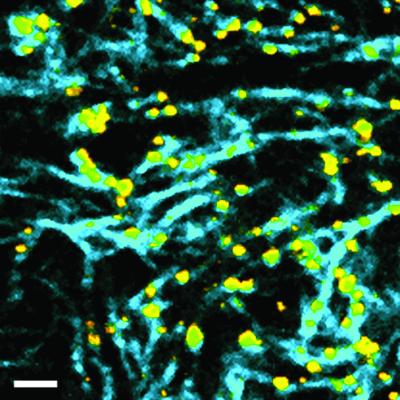
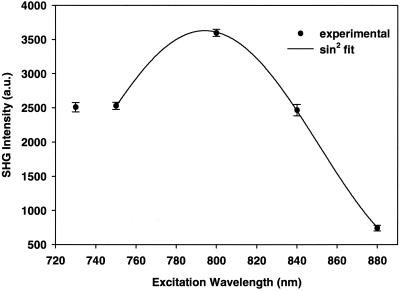
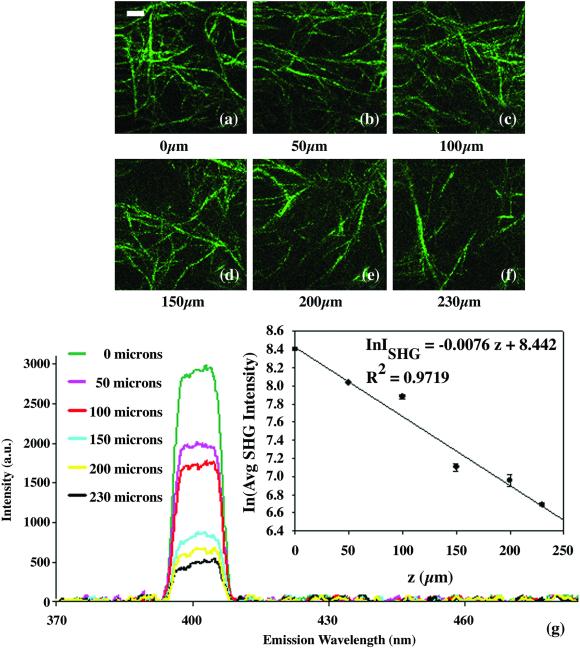
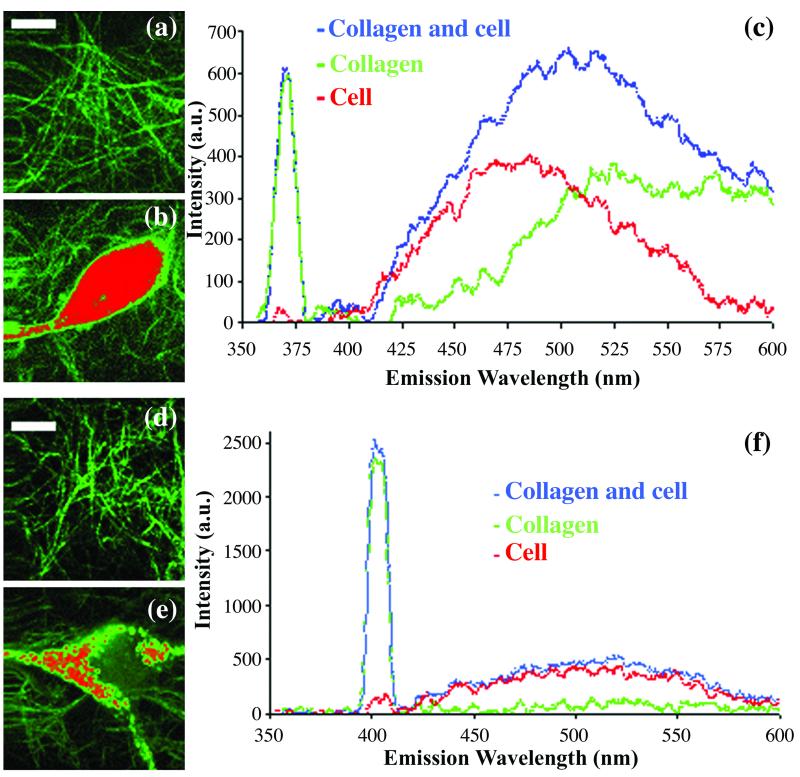
Multiphoton microscopy relies on nonlinear light-matter interactions to provide contrast and optical sectioning capability for high-resolution imaging. Most multiphoton microscopy studies in biological systems have relied on two-photon excited fluorescence (TPEF) to produce images. With increasing applications of multiphoton microscopy to thick-tissue "intravital" imaging, second-harmonic generation (SHG) from structural proteins has emerged as a potentially important new contrast mechanism. However, SHG is typically detected in transmission mode, thus limiting TPEF/SHG coregistration and its practical utility for in vivo thick-tissue applications. In this study, we use a broad range of excitation wavelengths (730-880 nm) to demonstrate that TPEF/SHG coregistration can easily be achieved in unstained tissues by using a simple backscattering geometry. The combined TPEF/SHG technique was applied to imaging a three-dimensional organotypic tissue model (RAFT). The structural and molecular origin of the image-forming signal from the various tissue constituents was determined by simultaneous spectroscopic measurements and confirming immunofluorescence staining. Our results show that at shorter excitation wavelengths (<800 nm), the signal emitted from the extracellular matrix (ECM) is a combination of SHG and TPEF from collagen, whereas at longer excitation wavelengths the ECM signal is exclusively due to SHG. Endogenous cellular signals are consistent with TPEF spectra of cofactors NAD(P)H and FAD at all excitation wavelengths. The reflected SHG intensity follows a quadratic dependence on the excitation power, decays exponentially with depth, and exhibits a spectral dependence in accordance with previous theoretical studies. The use of SHG and TPEF in combination provides complementary information that allows noninvasive, spatially localized in vivo characterization of cell-ECM interactions in unstained thick tissues.
Figures

Similar articles
-
Nonlinear spectral imaging of human hypertrophic scar based on two-photon excited fluorescence and second-harmonic generation.Br J Dermatol. 2009 Jul;161(1):48-55. doi: 10.1111/j.1365-2133.2009.09094.x. Epub 2009 Mar 20. Br J Dermatol. 2009. PMID: 19309369
-
Spectral characteristics of autofluorescence and second harmonic generation from ex vivo human skin induced by femtosecond laser and visible lasers.Scanning. 2006 Nov-Dec;28(6):319-26. doi: 10.1002/sca.4950280604. Scanning. 2006. PMID: 17181133
-
Three-dimensional high-resolution second-harmonic generation imaging of endogenous structural proteins in biological tissues.Biophys J. 2002 Jan;82(1 Pt 1):493-508. doi: 10.1016/S0006-3495(02)75414-3. Biophys J. 2002. PMID: 11751336 Free PMC article.
-
Second harmonic generation imaging of endogenous structural proteins.Methods. 2003 Jan;29(1):97-109. doi: 10.1016/s1046-2023(02)00292-x. Methods. 2003. PMID: 12543075 Review.
-
[Second- and third-harmonic generation microscopies for the structural imaging of intact tissues].Med Sci (Paris). 2006 Oct;22(10):845-50. doi: 10.1051/medsci/20062210845. Med Sci (Paris). 2006. PMID: 17026938 Review. French.
Cited by
-
Inhibition of advanced glycation end product formation and serum protein infiltration in bioprosthetic heart valve leaflets: Investigations of anti-glycation agents and anticalcification interactions with ethanol pretreatment.Biomaterials. 2022 Oct;289:121782. doi: 10.1016/j.biomaterials.2022.121782. Epub 2022 Sep 6. Biomaterials. 2022. PMID: 36099713 Free PMC article.
-
Microstructural characterization of vocal folds toward a strain-energy model of collagen remodeling.Acta Biomater. 2013 Aug;9(8):7957-67. doi: 10.1016/j.actbio.2013.04.044. Epub 2013 May 3. Acta Biomater. 2013. PMID: 23643604 Free PMC article.
-
Development of a nonlinear fiber-optic spectrometer for human lung tissue exploration.Biomed Opt Express. 2012 May 1;3(5):840-53. doi: 10.1364/BOE.3.000840. Epub 2012 Apr 3. Biomed Opt Express. 2012. PMID: 22567579 Free PMC article.
-
In vivo non-linear optical (NLO) imaging in live rabbit eyes using the Heidelberg Two-Photon Laser Ophthalmoscope.Exp Eye Res. 2010 Aug;91(2):308-14. doi: 10.1016/j.exer.2010.06.007. Epub 2010 Jun 15. Exp Eye Res. 2010. PMID: 20558159 Free PMC article.
-
Live tissue intrinsic emission microscopy using multiphoton-excited native fluorescence and second harmonic generation.Proc Natl Acad Sci U S A. 2003 Jun 10;100(12):7075-80. doi: 10.1073/pnas.0832308100. Epub 2003 May 19. Proc Natl Acad Sci U S A. 2003. PMID: 12756303 Free PMC article.
References
-
- Denk W., Strickler, J. H. & Webb, W. W. (1990) Science 248, 73-76. - PubMed
-
- Masters B. R., So, P. T. C. & Gratton, E. (1998) Lasers Med. Sci. 13, 196-203.
-
- Masters B. R. & So, P. T. C. (2001) Opt. Express 8, 2-10. - PubMed
-
- Agarwal A., Coleno, M. L., Wallace, V. P., Wu, W. Y., Sun, C. H., Tromberg, B. J. & George, S. C. (2001) Tissue Eng. 7, 191-202. - PubMed
-
- Diaspro A. & Robello, M. (2000) J. Photochem. Photobiol. B 55, 1-8. - PubMed
Publication types
MeSH terms
Substances
Grants and funding
LinkOut - more resources
Full Text Sources
Other Literature Sources
