. 2002 Aug 1;30(15):3312-22.
doi: 10.1093/nar/gkf462.

Transcriptional deregulation of the keratin 18 gene in human colon carcinoma cells results from an altered acetylation mechanism

Affiliations

Transcriptional deregulation of the keratin 18 gene in human colon carcinoma cells results from an altered acetylation mechanism

Philippe Prochasson et al. Nucleic Acids Res. .

Abstract

We are investigating the mechanism responsible for the overexpression of the keratin 18 (K18) gene in tumorigenic clones from the SW613-S human colon carcinoma cell line, as compared with non-tumorigenic clones. We have previously shown that this mechanism affects the minimal K18 promoter (TATA box and initiation site). We report here that treatment of the cells with histone deacetylase inhibitors stimulates the activity of the promoter in non-tumorigenic cells but has no effect in tumorigenic cells, resulting in a comparable activity of the promoter in both cell types. The adenovirus E1A protein inhibits the activity of the K18 promoter specifically in tumorigenic cells. This inhibition can be reversed by an excess of CBP protein. The conserved region 1 (CR1) of E1A, which is involved in the interaction with the CBP/p300 co-activators, is necessary to the inhibitory capacity of E1A. A 79 amino acid long N-terminal fragment of E1A, encompassing the two domains of E1A necessary and sufficient for binding to CBP (N-terminus and CR1), has the same differential inhibitory capacity on the K18 promoter as wild-type E1A. Forced recruitment of GAL4-CBP fusion proteins to the K18 promoter results in a greater stimulation of its activity in non-tumorigenic than in tumorigenic cells. The histone acetyltransferase activity of CBP is essential for this differential stimulation and the presence of the CBP2 domain greatly augments the activation capacity of the fusion protein. Chromatin immunoprecipitation experiments carried out with anti-acetylated histone antibodies showed no difference in the level of histone acetylation in the region of the K18 promoter between the two cell types. The structure of chromatin in the promoter region is similar in tumorigenic and non-tumorigenic cells, as determined by mapping of DNase I hypersensitive sites and probing the accessibility of the DNA to restriction endonucleases. From all these results we conclude that alteration of an acetylation mechanism involving the CBP (or p300) protein and acting on a non-histone substrate is responsible for the higher activity of the K18 promoter in tumorigenic cells of the SW613-S cell line.


Figures

Figure 1
Figure 1
Effect of different activators on the activity of the K18 promoter. (A) Construct pK18(41)luc corresponds to the K18 minimal promoter (TATA box and transcription start site). Concatenated copies of AP1-, Ets- or GTIIC-binding sites were inserted upstream of the minimal promoter, as indicated by the names of the plasmids. Plasmid pK18(80)luc contains the minimal promoter flanked by its natural upstream Sp1-binding site. Tumorigenic SW613-3 and non-tumorigenic SW613-B3 cells were transfected with the indicated plasmids. Two days after transfection, cell extracts were prepared and luciferase assays were performed. Luciferase activities are expressed relative to that obtained with plasmid pSVluc (SV40 early promoter) for each cell clone. The ratio of the luciferase activity in SW613-3 cells to that in SW613-B3 cells (δ factor) is indicated at the top. The experiments were performed three times. Error bars represent the SD of the mean of the three experiments. (B) The p(gal4)K18(80)luc construct contains three copies of a GAL4-binding site inserted upstream of the K18(80) promoter. Experiments were performed and results are presented as in (A), except that the experiments were performed five times and that SW613-3 and -B3 cells were co-transfected with plasmid p(gal4)K18(80)luc and with plasmids coding for the indicated polypeptides. GAL4–VP16, GAL4 DNA-binding domain fused to acidic domain H1 of VP16; GAL4 (DBD+AD), full-length GAL4 protein. (C) Experiments were carried out and results are presented as in (A) except that a logarithmic scale was chosen to take into account the large stimulation of the promoter activity achieved by some VP16 constructs. The experiments were repeated twice. A graphical representation of the GAL4–VP16 mutants is shown beside their names: black line, GAL4 DNA-binding domain; H1 and H2 boxes, VP16 acidic domains; the positions of mutated phenylalanine residues are indicated.
Figure 2
Figure 2
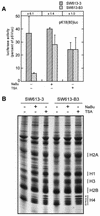
Effect of sodium butyrate and trichostatin A treatment on the activity of the K18(80) promoter. (A) SW613-3 or -B3 cells were transfected with plasmid pK18(80)luc and treated with 1 mM sodium butyrate (NaBu) or 300 nM trichostatin A (TSA). After 12 h, cell extracts were prepared and luciferase assays were performed. Experiments were performed and results are presented as in Figure 1A except that they were repeated six times. (B) Effect of deacetylase inhibitors on histone acetylation in SW613-3 and -B3 cells. Cells were treated for 12 h with 1 mM sodium butyrate (NaBu) or 300 nM TSA, as indicated. Histones were extracted from treated and untreated cells and analyzed on an acid-polyacrylamide gel containing urea and Triton X-100. The gel was stained with Coomassie blue. The different acetylated forms of histone H4 are indicated as follows: 0, non-acetylated; 1, monoacetylated; 2, diacetylated; 3, triacetylated; 4, tetraacetylated.
Figure 3
Figure 3
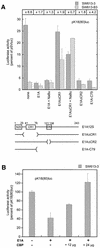
Effect of the adenovirus E1A protein on the activity of the K18(80) promoter. (A) SW613-3 and -B3 cells were co-transfected with plasmid pK18(80)luc and one of the plasmids coding for the indicated polypeptides. E1A, full-length E1A12S protein; E1AΔCR1 and E1AΔCR2, E1A12S proteins with in-phase deletions between amino acids 30 and 85 or between amino acids 122 and 129, respectively. The E1A–C79 polypeptide consists of the N-terminal 79 amino acids of the E1A protein. Cells were treated (+NaBu) or not with 1 mM of sodium butyrate from the time of transfection. Experiments were performed and results are presented as in Figure 1A. They were repeated twice. The structure of the E1A12S protein and of the deletion mutants is schematized beneath the histogram. Numbering is in amino acids. (B) SW613-3 cells were transfected with plasmid pK18(80)luc alone or together with plasmids coding for the full-length E1A12S (E1A) or CBP protein, as indicated. Plasmid coding for E1A (0.5 µg) and varying quantities of plasmid coding for CBP were used, as indicated. Experiments were performed and results are presented as in Figure 1A, except that they were repeated twice. Luciferase activities are expressed relative to that obtained with plasmid pK18(80)luc.
Figure 4
Figure 4
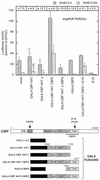
Effect of different domains of the CBP protein on the activity of the K18(80) promoter. SW613-3 and -B3 cells were transfected with the plasmid pK18(80)luc alone (none) or together with one of the plasmids encoding the indicated polypeptides. Fold increase of the luciferase activity obtained in the presence of the GAL4–CBP HAT fusion protein, relative to that obtained in the presence of the GAL4–CBP HATΔ protein in the same cell type (×1), is indicated above each bar. Experiments were performed (three times) and results are presented as in Figure 1A. The structure of the fusion proteins between the DNA-binding domain of GAL4 and different domains of the CBP protein is schematized in the diagram below [adapted from Martinez-Balbas et al. (32)]. Numbering is in amino acids. Cys, ZZ and TAZ are putative zinc-finger regions. The CBP2 domain encompasses the ZZ and TAZ cysteine-rich regions and harbors the binding site for E1A and several other transcriptional activators. Bromo, the bromodomain; HAT, the histone acetyltransferase domain. The binding domain for CREB and other factors is indicated by a striped box and the GAL4 DNA-binding domain by a black box.
Figure 5
Figure 5
Acetylation level of histone H3 in the promoter region of the resident K18 gene. (A) Chromatin immunoprecipitation assays were performed as described in Materials and Methods for the promoter regions of the indicated genes. SW613-3 or -B3 cells were treated (+) or not (–) with sodium butyrate as described in Figure 2B and immunoprecipitation reactions were done in the presence (+) or absence (–) of anti-acetylated histone H3 antibody (Ab). Polymerase chain reaction amplification was for 30 cycles and the products were analyzed by agarose gel electrophoresis and ethidium bromide staining. Their sizes are indicated on the right. (B) For quantification purposes 15, 20 and 25 cycles of amplification were carried out and the products were analyzed by Southern blotting using as probes the 32P-labeled purified fragments. Radioactive signals were quantified as described in Materials and Methods and the average results of the three series of amplification are given. The results are expressed as the ratio of the signals obtained with SW613-3 and -B3 cells for each gene.
Figure 6
Figure 6
Acetylation level of histone H3 in the region of the K18 promoter in transient expression assays. (A) SW613-3 and -B3 cells were transfected with the pK18(80)luc (K18) or the pSVluc (SV40) plasmid and chromatin immunoprecipitation assays were performed as described in Materials and Methods. Immunoprecipitation reactions were done in the presence (+) or absence (–) of anti-acetylated histone H3 antibody (Ab). Polymerase chain reaction amplification was for 25 cycles. The assays were performed in duplicate and the products were analyzed by agarose gel electrophoresis and ethidium bromide staining. Their sizes are indicated on the right. The amplification reaction of the first lane (–) was carried out without added template, as a control. (B) Luciferase activity was determined in transfected cell extracts as described in Figure 1A and is expressed relative to that obtained with plasmid pSVluc for each cell clone. Products of the polymerase chain reaction amplification of the chromatin immunoprecipitation assays (ChIP) were quantified after agarose gel electrophoresis and ethidium bromide staining (see Materials and Methods). Preliminary experiments with varying quantities of input template (data not shown) allowed the determination of reaction conditions yielding a linear relationship between input and signal after 25 cycles of amplification. The results are expressed as the ratio between the K18 and the SV40 signal for each cell clone. The ratios of the normalized luciferase activities and amplification signals obtained with SW613-3 and -B3 cells are also given.
Figure 7
Figure 7
Analysis of the chromatin structure in the promoter region of the resident K18 gene. (A) Nuclei prepared from tumorigenic SW613-12A1 or non- tumorigenic SW613-B3 cells were treated with increasing concentrations of DNase I (0, 10 or 20 µg/ml). DNA was extracted and analyzed by Southern blotting after digestion with the EcoNI or PstI restriction endonuclease, as indicated, using probes A or A and B, respectively. DNA extracted from human EJ/T24 cells (ATCC HTB-4) was used as a control. The position and size (bp) of the fragments generated by the DNase I hypersensitive sites are indicated by arrowheads and those of the molecular weight markers are indicated on the right. A map of the 5′ region of the human K18 gene is presented beneath. The position of the first two exons, of the TATA box, of the Sp1-binding site important for the promoter activity, of the A and B probes and of the mapped DNase I hypersensitive sites (thick arrows) is indicated. (B) Nuclei prepared from tumorigenic SW613-3 or non-tumorigenic SW613-B3 cells were treated or not (none) with the AvaI or HphI restriction endonuclease, as indicated. DNA was extracted, digested with the EcoNI restriction endonuclease and analyzed by Southern blotting using probe A. The position of the sites for these enzymes is indicated on the map of the 5′ region of the human K18 gene shown beneath.

Similar articles

Cited by

References

    1. Orphanides G., Lagrange,T. and Reinberg,D. (1996) The general transcription factors of RNA polymerase II. Genes Dev., 10, 2657–2683. - PubMed
    1. Paranjape S.M., Kamakaka,R.T. and Kadonaga,J.T. (1994) Role of chromatin structure in the regulation of transcription by RNA polymerase II. Annu. Rev. Biochem., 63, 265–297. - PubMed
    1. Wolffe A.P. (1992) New insights into chromatin function in transcriptional control. FASEB J., 6, 3354–3361. - PubMed
    1. Goodman R.H. and Smolik,S. (2000) CBP/p300 in cell growth, transformation and development. Genes Dev., 14, 1553–1577. - PubMed
    1. Kornberg R.D. and Lorch,Y. (1999) Twenty-five years of the nucleosome, fundamental particle of the eukaryote chromosome. Cell, 98, 285–294. - PubMed

Publication types

MeSH terms