

Frequency-selective augmenting responses by short-term synaptic depression in cat neocortex
- PMID: 12122156
- PMCID: PMC2316151
- DOI: 10.1113/jphysiol.2001.012759
Frequency-selective augmenting responses by short-term synaptic depression in cat neocortex
Abstract
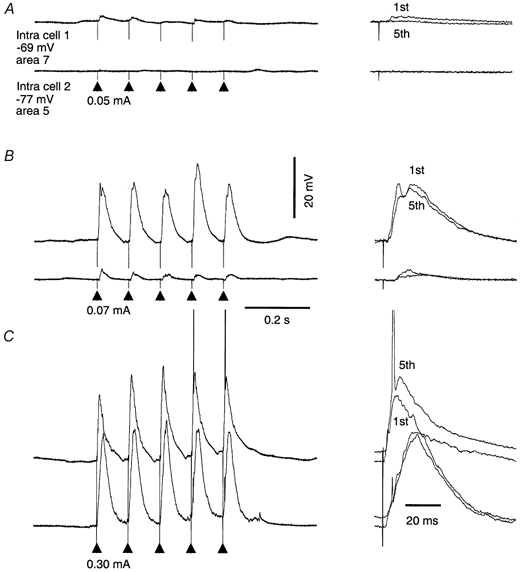
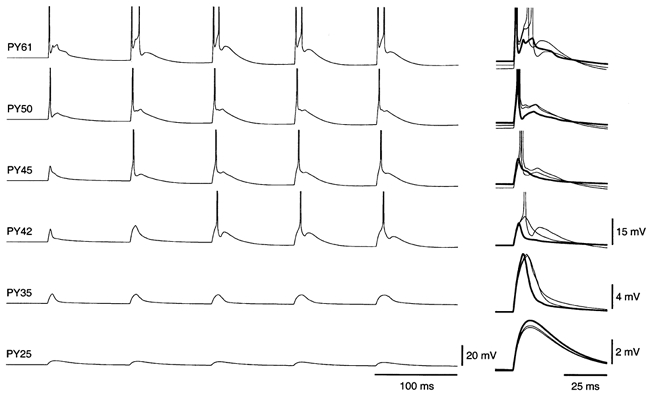
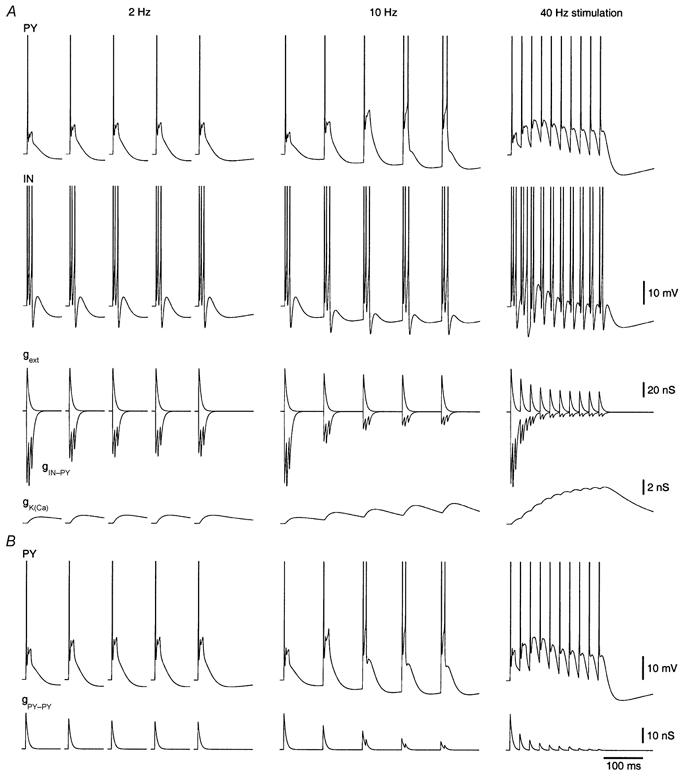
Thalamic stimulation at frequencies between 5 and 15 Hz elicits incremental or 'augmenting' cortical responses. Augmenting responses can also be evoked in cortical slices and isolated cortical slabs in vivo. Here we show that a realistic network model of cortical pyramidal cells and interneurones including short-term plasticity of inhibitory and excitatory synapses replicates the main features of augmenting responses as obtained in isolated slabs in vivo. Repetitive stimulation of synaptic inputs at frequencies around 10 Hz produced postsynaptic potentials that grew in size and carried an increasing number of action potentials resulting from the depression of inhibitory synaptic currents. Frequency selectivity was obtained through the relatively weak depression of inhibitory synapses at low frequencies, and strong depression of excitatory synapses together with activation of a calcium-activated potassium current at high frequencies. This network resonance is a consequence of short-term synaptic plasticity in a network of neurones without intrinsic resonances. These results suggest that short-term plasticity of cortical synapses could shape the dynamics of synchronized oscillations in the brain.
Figures


Similar articles
-
Short- and medium-term plasticity associated with augmenting responses in cortical slabs and spindles in intact cortex of cats in vivo.J Physiol. 2002 Jul 15;542(Pt 2):583-98. doi: 10.1113/jphysiol.2001.013479. J Physiol. 2002. PMID: 12122155 Free PMC article.
-
Mechanisms of target-cell specific short-term plasticity at Schaffer collateral synapses onto interneurones versus pyramidal cells in juvenile rats.J Physiol. 2005 Nov 1;568(Pt 3):815-40. doi: 10.1113/jphysiol.2005.093948. Epub 2005 Aug 18. J Physiol. 2005. PMID: 16109728 Free PMC article.
-
Synchronized gamma-frequency inhibition in neocortex depends on excitatory-inhibitory interactions but not electrical synapses.J Neurophysiol. 2016 Aug 1;116(2):351-68. doi: 10.1152/jn.00071.2016. Epub 2016 Apr 27. J Neurophysiol. 2016. PMID: 27121576 Free PMC article.
-
Does inhibition balance excitation in neocortex?Prog Biophys Mol Biol. 2005 Jan;87(1):109-43. doi: 10.1016/j.pbiomolbio.2004.06.008. Prog Biophys Mol Biol. 2005. PMID: 15471593 Review.
-
Motor cortical and other cortical interneuronal networks that generate very high frequency waves.Suppl Clin Neurophysiol. 2003;56:119-42. doi: 10.1016/s1567-424x(09)70214-4. Suppl Clin Neurophysiol. 2003. PMID: 14677387 Review.
Cited by
-
Short- and medium-term plasticity associated with augmenting responses in cortical slabs and spindles in intact cortex of cats in vivo.J Physiol. 2002 Jul 15;542(Pt 2):583-98. doi: 10.1113/jphysiol.2001.013479. J Physiol. 2002. PMID: 12122155 Free PMC article.
-
Depth-dependent temporal response properties in core auditory cortex.J Neurosci. 2011 Sep 7;31(36):12837-48. doi: 10.1523/JNEUROSCI.2863-11.2011. J Neurosci. 2011. PMID: 21900562 Free PMC article.
-
Membrane resonance in bursting pacemaker neurons of an oscillatory network is correlated with network frequency.J Neurosci. 2009 May 20;29(20):6427-35. doi: 10.1523/JNEUROSCI.0545-09.2009. J Neurosci. 2009. PMID: 19458214 Free PMC article.
-
Oscillations in large-scale cortical networks: map-based model.J Comput Neurosci. 2004 Sep-Oct;17(2):203-23. doi: 10.1023/B:JCNS.0000037683.55688.7e. J Comput Neurosci. 2004. PMID: 15306740
-
The spectro-contextual encoding and retrieval theory of episodic memory.Front Hum Neurosci. 2014 Feb 18;8:75. doi: 10.3389/fnhum.2014.00075. eCollection 2014. Front Hum Neurosci. 2014. PMID: 24600373 Free PMC article.
References
-
- Abbott LF, Varela JA, Sen K, Nelson SB. Synaptic depression and cortical gain control. Science. 1997;275:220–224. - PubMed
-
- Bazhenov M, Timofeev I, Steriade M, Sejnowski TJ. Cellular and network models for intrathalamic augmenting responses during 10-Hz stimulation. Journal of Neurophysiology. 1998a;79:2730–2748. - PubMed
-
- Bazhenov M, Timofeev I, Steriade M, Sejnowski TJ. Self-sustained rhythmic activity in the thalamic reticular nucleus mediated by depolarizing GABAA receptor potentials. Nature Neuroscience. 1999;2:168–174. - PubMed
Publication types
MeSH terms
LinkOut - more resources
Full Text Sources
Miscellaneous