. 2002 May;76(10):5014-23.
doi: 10.1128/jvi.76.10.5014-5023.2002.

Human TATA binding protein inhibits human papillomavirus type 11 DNA replication by antagonizing E1-E2 protein complex formation on the viral origin of replication

Affiliations

Human TATA binding protein inhibits human papillomavirus type 11 DNA replication by antagonizing E1-E2 protein complex formation on the viral origin of replication

Kelly A Hartley et al. J Virol. 2002 May.

Abstract

The human papillomavirus (HPV) protein E2 possesses dual roles in the viral life cycle. By interacting directly with host transcription factors in basal keratinocytes, E2 promotes viral transcription. As keratinocyte differentiation progresses, E2 associates with the viral helicase, E1, to activate vegetative viral DNA replication. How E2's major role switches from transcription to replication during keratinocyte differentiation is not understood, but the presence of a TATA site near the viral origin of replication led us to hypothesize that TATA-binding protein (TBP) could affect HPV replication. Here we show that the C-terminal domain of TBP (TBPc) is a potent inhibitor of E2-stimulated HPV DNA replication in vitro (50% inhibitory concentration = 0.56 nM). Increasing the E1 concentration could not overcome TBPc inhibition in replication assays, indicating that TBPc is a noncompetitive inhibitor of E1 binding. While direct E2-TBPc association could be demonstrated, this interaction could not fully account for the mechanism of TBPc-mediated inhibition of viral replication. Because E2 supports sequence-specific binding of E1 to the viral ori, we proposed that TBPc antagonizes E1-ori association indirectly through inhibition of E2-DNA binding. Indeed, TBPc potently antagonized E2 binding to DNA in the absence (K(i) = 0.5 +/- 0.1 nM) and presence (K(i) = 0.6 +/- 0.3 nM) of E1. Since E2 and TBPc cannot be coadjacent on viral sequences, direct DNA-binding competition between TBPc and E2 was responsible for replication inhibition. Given the ability of TBPc to inhibit HPV DNA replication in vitro and data indicating that TBPc antagonized E2-ori association, we propose that transcription factors regulate HPV DNA replication as well as viral transcription.


Figures

FIG. 1.
FIG. 1.
3′ end of the HPV-11 LCR (P93 promoter), structures of fluorescein-labeled oligonucleotides TATASITE, E2TATA, and E1E2TATA, and description of pUC18/7870-99. (A) The phosphoramidite-linked fluorescein moiety structure is illustrated. (B) The sequence of the 3′ end of the HPV-11 LCR and the positions of the E1, E2, and TBP binding sites are illustrated, as well as oligonucleotides TATASITE, E2TATA, and E1E2TATA. The sequence of TATASITE contains the full TATA box and its flanking bases, nucleotides 58 to 75. Oligonucleotide E2TATA, nucleotides 45 to 89, contains the TATA box and the adjacent E2 site. Oligonucleotide E1E2TATA, nucleotides 7908 to 98, contains the E1, two E2, and TBP binding sites. The plasmid pUC18/7870-99 contains nucleotides 7870 to 99 with the E1, three E2, and TBP binding sites ligated into pUC18. Note that sequence numbering begins at the origin in the E1 binding site.
FIG. 2.
FIG. 2.
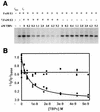
TBPc inhibits E2-stimulated replication and does not affect E2-independent replication. (A) NdeI-digested replication products from cell-free replication assays using HPV-11 ori-containing plasmid (pUC18/7870-99) and increasing TBPc. Cell-free replication assays were performed as outlined in Materials and Methods. E1, E2, and TBPc are added as noted. Lanes correlating to initial and base intensity of counts (I0 and Ibase) are indicated. (B) Several E2-stimulated (circles) and E2-independent (squares) replication assays with increasing TBPc concentration were quantified by PhosphoImager and filter washing as outlined in Materials and Methods. Data were normalized to E2-stimulated replication. The data were fit to 2-parameter hyperbolic decay (r2 = 0.96 with E2 present) and first-order polynomial regression curves (y-intercept = 0.657; correlation coefficient = 1.12 × 10⁻⁵ without E2 present). Analysis of 2-parameter hyperbolic decay yields an IC50 of 0.56 nM.
FIG. 3.
FIG. 3.
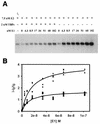
Increasing E1 concentration is not sufficient to overcome inhibition by TBPc in cell-free replication assays. (A) NdeI-digested replication products from cell-free replication assays using HPV-11 ori-containing plasmid (pUC18/7870-99) and increasing E1. Cell-free replication assays were performed as outlined in Materials and Methods. E1, E2, and TBPc are added as noted. Lanes correlating to initial intensity (I0) are indicated. (B) Several replication assays with (circles) and without (squares) TBPc were quantified by PhosphoImager and filter washing as outlined in Materials and Methods. The data were fit to single rectangular hyperbolic curves (r2 = 0.97 and 0.95, with and without TBPc present, respectively). Note that the curves generated by the data indicate that TBPc acts as a noncompetitive inhibitor.
FIG. 4.
FIG. 4.
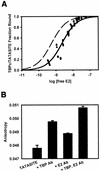
Association of HPV-11 E2 with TBPc-TATASITE. (A) E2 was titrated onto 1 nM TBPc-TATASITE in titration buffer as described in Materials and Methods. The fluorescence anisotropy of the solution was determined after each addition of E2. The data behaved as a single class of noninteracting E2 binding sites. Using the observed fluorescence anisotropies of the free and bound TBPc-TATASITE, the fraction of TBPc-TATASITE bound to E2 was calculated. The data were fit to the Michaelis-Menton equation using a Newton-Gauss iterative least-squares regression analysis assuming a single class of noninteracting E2 binding sites (SigmaPlot). The fraction of TBPc-TATASITE bound by E2 was plotted as a function of the log of the free E2 concentration. The binding curve shown corresponds to an E2-TBPc-TATASITE Kd of 2.3 nM (r2= 0.96). A theoretical curve (dashed line) corresponding to a Kd of 0.56 nM (r2 = 0.58 with this data) is illustrated. (B) Upon saturation of TBPc-TATASITE with E2, rabbit polyclonal anti-TBP and rabbit polyclonal anti-E2 antibodies were added. The fluorescence anisotropy of the solutions was determined for each antibody separately and combined. The addition of each antibody resulted in statistically significant anisotropy increases, confirming that fluorescence anisotropy is affected by the presence of each protein. The anisotropy measurement from adding both antibodies was cumulative and significant, showing the presence of both TBPc and E2 on TATASITE.
FIG. 5.
FIG. 5.
Association of HPV-11 E2 with E2TATA in the presence and absence of excess TBPc. E2 was titrated into 1 nM E2TATA in titration buffer, and the fluorescence anisotropy of the solution was determined after each addition of E2 as described in Materials and Methods. For titrations in the presence of TBPc, a final concentration of 2 or 4 nM TBPc was added prior to the addition of E2. Using the observed fluorescence anisotropies of the free and bound oligonucleotide, the fraction of oligonucleotide bound to E2 could be calculated as described in Materials and Methods. The fraction of E2TATA bound by E2 was then plotted as a function of the log of the free E2 concentration as described in Fig. 4. The binding curves shown correspond to E2-E1E2TATA Kds of 1.1 nM (no TBPc, circles; r2 = 0.96), 4.3 nM (with 2 nM TBPc, squares; r2 = 0.99), and 10.3 nM (with 4 nM TBPc, triangles; r2 = 0.96), respectively. The Ki of TBPc was determined to be 0.5 ± 0.1 nM.
FIG. 6.
FIG. 6.
Association of HPV-11 E2 with E1E2TATA in the presence and absence of excess HPV-11 E1. E1E2TATA (1nM) in titration buffer was titrated with E2. For titrations in the presence of E1, a final concentration of 10 nM E1 was added prior to titration with E2. Data were collected and analyzed as described above. Since the E2-E1E2TATA interaction did not reach saturation, the data were not fit to a curve, and the [E2]0.5 (≈Kd) could only be estimated. The E1-E2-E1E2TATA interaction was analyzed by Hill fit to examine cooperativity of E2 binding. Because E2 binds to two sites, the graph is expressed as total E2 concentration as a function of relative anisotropy change, experimental saturation being 1.0. The binding curves correspond to an [E2]0.5 bound of 2.1 nM with a Hill coefficient of 1.5 (with E1, circles; r2 = 0.99) and an [E2]0.5 bound of >150 nM (without E1, squares; estimated).
FIG. 7.
FIG. 7.
Association of HPV-11 E2 and HPV-11 E1 with E1E2TATA in the presence and absence of excess TBPc. One nanomolar E1E2TATA and 10 nM E1 in titration buffer were titrated with E2. In titrations with excess TBPc, a final concentration of 2 or 8 nM TBPc was added before titration with E2. Data were collected and analyzed as above. The binding curves correspond to apparent [E2]0.5 bound values (as defined above) of 2.1 nM (no TBPc, circles; Hill coefficient = 1.5; r2 = 0.99), 6.3 nM (with 2 nM TBPc, squares; Hill coefficient = 1.4; r2 = 0.98), and 65 nM (with 8 nM TBPc, triangles; r2= 0.98). The Ki of TBPc was determined to be 0.6 ± 0.3 nM.
FIG. 8.
FIG. 8.
No TBPc is present on fluorescent oligonucleotides at the point of saturation with E2. First anti-TBP and then anti-E2 rabbit polyclonal antibodies were added to 1 nM E2TATA or E1E2TATA, 2 nM TBPc, a saturating concentration of E2 (32 nM), and 10 nM E1, in the case of E1E2TATA, in titration buffer. A small (nonsaturating) amount of murine anti-E1 antibody was added to the E1E2TATA sample after anti-E2 was added. After each addition of antibody the change in fluorescence anisotropy was measured. The addition of anti-TBP antibody did not yield a statistically significant anisotropy increase for either oligonucleotide saturated with E2, but the addition of anti-E2 (and anti-E1) antibody did produce significant increases.
FIG. 9.
FIG. 9.
Model of TBP-mediated coordinated control of viral replication and transcription. See Discussion.

Similar articles

Cited by

References

    1. Apt, D., R. M. Watts, G. Suske, and H. U. Bernard. 1996. High Sp1/Sp3 ratios in epithelial cells during epithelial differentiation and cellular transformation correlate with the activation of the HPV-16 promoter. Virology 224:281-291. - PubMed
    1. Barksdale, S. K., and C. C. Baker. 1993. Differentiation-specific expression from the bovine papillomavirus type 1 P2443 and late promoters. J. Virol. 67:5605-5616. - PMC - PubMed
    1. Bream, G. L., C. A. Ohmstede, and W. C. Phelps. 1993. Characterization of human papillomavirus type 11 E1 and E2 protein expressed in insect cells. J. Virol. 67:2655-2663. - PMC - PubMed
    1. Chao, S.-F., W. J. Rocque, S. Daniel, L. E. Czyzyk, W. C. Phelps, and K. A. Alexander. 1999. Subunit affinities and stoichiometries of the human papillomavirus type 11 E1:E2:DNA complex. Biochemistry 38:4586-4594. - PubMed
    1. Chiang, C.-M., G. Dong, T. R. Broker, and L. T. Chow. 1992. Control of human papillomavirus type 11 origin of replication by the E2 family of transcription regulatory proteins. J. Virol. 66:5224-5231. - PMC - PubMed

Publication types