. 2002 Apr 1;540(Pt 1):307-20.
doi: 10.1113/jphysiol.2001.012974.

A novel mechanism of response selectivity of neurons in cat visual cortex

Affiliations

A novel mechanism of response selectivity of neurons in cat visual cortex

Maxim Volgushev et al. J Physiol. .

Abstract

The spiking of cortical neurons critically depends on properties of the afferent stimuli. In the visual cortex, neurons respond selectively to the orientation and direction of movement of an object. The orientation and direction selectivity is improved upon transformation of the membrane potential changes into trains of action potentials. To address the question of whether the transformation of the membrane potential changes into spiking of a cell depends on the stimulus orientation and the direction of movement, we made intracellular recordings from the cat visual cortex in vivo during presentation of moving gratings of different orientations. We found that the relationship between the membrane polarization and the firing rate (input-output transfer function) depended on the stimulus orientation. The input-output transfer function was steepest during responses to the optimal stimulus; membrane depolarization of a given amplitude led to generation of more action potentials when evoked by an optimal stimulus than during non-optimal stimulation. The threshold for the action potential generation did not depend on stimulus orientation, and thus could not account for the observed difference in the transfer function. Oscillations of the membrane potential in the gamma-frequency range (25-70 Hz) were most pronounced during optimal stimulation and their strength changed in parallel with the changes in the transfer function, suggesting a possible relationship between the two parameters. We suggest that the improved input-output relationship of neurons during optimal stimulation represents a novel mechanism that may contribute to the final sharp orientation selectivity of spike responses in the cortical cells.


Figures
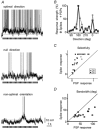
Figure 1
Figure 1. Orientation selectivity of postsynaptic potential and spike responses
A, responses of a complex cell in cat visual cortex to a grating moving in the optimal direction, in the opposite (null) direction and to the non-optimally oriented grating. In this and subsequent figures, grey horizontal lines indicate the mean membrane potential during the interstimulus intervals (−78 mV for this cell), and bars below the membrane potential traces indicate grating on- and off-set, period of movement and temporal frequency. Action potentials are truncated. B, dependence of the amplitude of the membrane potential response (PSPs, •) and of the spike response (Spikes, □) on the direction of stimulus movement for the cell shown in A. The strength of both PSP and spike responses is normalized between 0 and 100 % to facilitate comparison of tuning curves. C, scatter diagram showing the relationship between the selectivity of the spike responses (ordinate) and the membrane potential responses (abscissa) for the whole sample. □, orientation selectivity data; ▪, direction selectivity data. D, scatter diagram showing the relationship between the bandwidth of orientation tuning of spike responses (ordinate) and membrane potential responses (abscissa) for the whole sample.
Figure 2
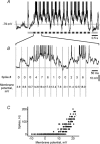
Figure 2. Calculation of the input-output transfer function of a cell
A, response of a simple cell to a moving grating; spikes are truncated. B, part of the response in A shown at an expanded (× 10) time scale and divided into successive 50 ms intervals (vertical grey lines). In each interval the number of spikes and the deviation of the membrane potential from the mean resting level were calculated. C, plot of PSP-to-spike transfer function using pairs of the membrane potential and spiking frequency values obtained from each 50 ms window of the whole response shown in A. The transfer function shows the dependence of spiking frequency (ordinate) on the membrane polarization relative to the mean resting level (abscissa). A regression line was calculated for the time windows with spikes. r = 0.74, P < 0.001.
Figure 3
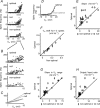
Figure 3. Transformation of PSPs to spike responses depends on stimulus orientation
A, PSP-to-spike transfer functions of a cell calculated from 5 s responses to presentation of optimal grating, the same grating moving in a null direction and non-optimally oriented grating. Width of the sliding window for estimation of the transfer function was 50 ms. Optimal: r = 0.71, P < 0.001; null: r = 0.44, P < 0.001; non-optimal: r = 0.46, P < 0.05. B, PSP-to-spike transfer functions in a selected range of PSP response amplitudes, as indicated in A. The range was selected to yield a similar mean amplitude of PSP responses to stimuli of any orientation. Regression lines and their slopes were calculated for all data points within the selected range. Optimal: r = 0.71; null: r = 0.61; non-optimal: r = 0.62; P < 0.001 for all three cases. C, superimposed regression lines for PSP-to-spike transfer functions within the selected range of matching PSP amplitudes for eight stimulus orientations. Note that transfer functions are steeper during presentation of optimally oriented stimuli moving in either (optimal or null) directions when compared to stimuli of other than optimal orientations. D, running window averages of PSP-to-spike transfer function during the optimal and non-optimal stimulation (data from A). To calculate the running window average, membrane potential and spiking frequency values were averaged within 2 mV intervals and connected by the line. E, relationship between the slopes of PSP-to-spike transfer functions during optimal stimulation (ordinate) and during null (circles) or non-optimal (diamonds) stimulation (abscissa) for the whole sample. Regression lines and their slopes were calculated (as in the example shown in A) for the time windows during which spikes were generated. F, population data for the relationship between the mean value of the membrane potential in the 50 ms windows and 1–3 action potentials during optimal stimulation (ordinate) and non-optimal stimulation (abscissa). G and H, population data for the relationship between the slopes of PSP-to-spike transfer functions (G) and output/input ratios (H) within selected ranges of matching amplitudes of PSP responses to optimal, null and non-optimal stimulation. The slope of the transfer function (G) and output/input ratio (H) during optimal stimulation (ordinate) are plotted against those during null or non-optimal stimulation (abscissa). The slope of the transfer function was calculated as in the example illustrated in B, within selected ranges of matching PSP response amplitudes; the output/input ratio was calculated as mean spiking frequency divided by the mean membrane potential response. In E-H, diagonals show equality lines.
Figure 4
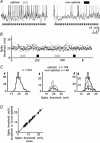
Figure 4. Threshold for action potential generation does not depend on stimulus orientation
A, responses of a cortical cell to the moving grating of optimal and non-optimal orientation. Mean membrane potential during the interstimulus intervals was −69 mV; spikes are truncated. B, thresholds of 818 action potentials generated by a cortical cell during responses to moving gratings of different orientation and during interstimulus intervals. Each point represents the threshold of one action potential. Spikes generated during responses to optimal and non-optimal stimulation are indicated by the grey and filled bars, respectively. Since more spikes occurred during the optimal stimulation, the grey bars are longer. Other orientations are not indicated for clarity. C, distribution of the thresholds of the action potentials generated during the whole period of analysis (left), during optimal and non-optimal responses (middle), and superposition of the three distributions (right). Note that the three distributions do not differ significantly. Data in A-C are from the same cell. D, relationship between the threshold for action potential generation during presentation of stimuli of optimal (squares) or non-optimal (diamonds) orientation (ordinate) and the mean spike threshold estimated for the period of presentation of the whole set of orientations (abscissa). Data for 15 cells. Diagonal shows an equality line.
Figure 5
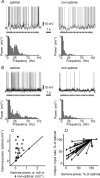
Figure 5. Strength of membrane potential oscillations in the γ-frequency range depends on stimulus orientation and is related to the PSP-to-spike transfer function of the cell
A and B, responses of a simple (A) and a complex (B) cell to gratings of the optimal and non-optimal orientations and power spectra, calculated after removing the spikes. The mean membrane potential during interstimulus intervals (grey lines) was −64 mV in A and −74 mV in B. Initial bins of power spectra are truncated. Note the stronger oscillations of the membrane potential in the γ-frequency range (25–70 Hz) during the optimal stimulation in both cells. C, relationship between the strength of membrane potential oscillations in the γ-frequency range during optimal stimulation (ordinate) and during grating movement in the null direction or at non-optimal orientation (abscissa) for the whole sample. Diagonal shows equality line. D, relationship between changes of output/input ratio (ordinate) and power of γ-frequency oscillations of the membrane potential (abscissa) with stimulus orientation. For each cell, the output/inputc ratio within a range of matching amplitudes (see Fig. 3B, E and F for details) and the γ-power of the membrane potential oscillations during presentation of grating of non-optimal orientation (diamonds) or moving in the null direction (circles) were plotted as a percentage of the optimal for the cell and connected with a line to the optimum (asterisk, 100 %). Note the clear tendency for the output/input ratio to increase when the γ-power increases.

Similar articles

Cited by

References

    1. Albrecht DG, Geisler WS. Motion selectivity and the contrast-response function of simple cells in the visual cortex. Visual Neuroscience. 1991;7:531–546. - PubMed
    1. Azouz R, Gray CM. Cellular mechanisms contributing to response variability of cortical neurons in vivo. Journal of Neuroscience. 1999;19:2209–2223. - PMC - PubMed
    1. Azouz R, Gray CM. Dynamic spike threshold reveals a mechanism for synaptic coincidence detection in cortical neurons in vivo. Proceedings of the National Academy of Sciences of the USA. 2000;97:8110–8115. (abstract) - PMC - PubMed
    1. Benevento LA, Creutzfeldt OD, Kuhnt U. Significance of intracortical inhibition in the visual cortex. Nature. 1972;238:124–126. - PubMed
    1. Bringuier V, Fregnac Y, Baranyi A, Debanne D, Shulz DE. Synaptic origin and stimulus dependency of neuronal oscillatory activity in the primary visual cortex of the cat. Journal of Physiology. 1997;500:751–774. - PMC - PubMed

Publication types

LinkOut - more resources