. 2002 Mar 4;156(5):879-92.
doi: 10.1083/jcb.200110014. Epub 2002 Feb 25.

Modulation of the F-actin cytoskeleton by c-Abl tyrosine kinase in cell spreading and neurite extension

Affiliations

Modulation of the F-actin cytoskeleton by c-Abl tyrosine kinase in cell spreading and neurite extension

Pamela J Woodring et al. J Cell Biol. .

Abstract

The nonreceptor tyrosine kinase encoded by the c-Abl gene has the unique feature of an F-actin binding domain (FABD). Purified c-Abl tyrosine kinase is inhibited by F-actin, and this inhibition can be relieved through mutation of its FABD. The c-Abl kinase is activated by physiological signals that also regulate the actin cytoskeleton. We show here that c-Abl stimulated the formation of actin microspikes in fibroblasts spreading on fibronectin. This function of c-Abl is dependent on kinase activity and is not shared by c-Src tyrosine kinase. The Abl-dependent F-actin microspikes occurred under conditions where the Rho-family GTPases were inhibited. The FABD-mutated c-Abl, which is active in detached fibroblasts, stimulated F-actin microspikes independent of cell attachment. Moreover, FABD-mutated c-Abl stimulated the formation of F-actin branches in neurites of rat embryonic cortical neurons. The reciprocal regulation between F-actin and the c-Abl tyrosine kinase may provide a self-limiting mechanism in the control of actin cytoskeleton dynamics.


Figures
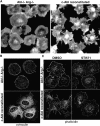
Figure 1.
Figure 1.
c-Abl activity contributes to cell spreading. (A) Double knock out cells (Abl−/− Arg−/−) reconstituted with vector (left) or c-Abl (right) were detached, held in suspension 45 min, then plated onto a fibronectin-coated surface for 20 min. Cells were fixed and stained with TRITC-conjugated phalloidin to visualize the F-actin cytoskeleton. (B) Cells were treated as in A except they were fixed at 35 min after plating onto fibronectin and αvinculin/α-mouse Texas red (Sigma-Aldrich) was used for staining to visualize focal contacts. (C) Double knock out cells reconstituted with vector (top) or c-Abl (bottom) were pretreated with either the vehicle control, DMSO (left) or 3 μM STI571 (right). In the continued presence of DMSO or STI571 cells were detached, held in suspension for 45 min, and replated onto a fibronectin-coated surface for 30 min. Fixed cells were stained with FITC-conjugated phalloidin. (D) Src knock out cells (Src−/−) reconstituted with vector (top left) or c-Src (top right) were detached and spread onto a fibronectin-coated surface, then stained as in A. The indicated cells were pretreated with 3 μM STI571 or 1 μM SU6656 (middle). Bottom panels show 293T cells overexpressing activated Src(Y529F). 24 h after transfection cells were pretreated with DMSO (left) or STI571 (right). Cells were detached and replated onto fibronectin as in A. Transfected cells were located by staining with αSrc/FITC-αmouse, and the actin cytoskeleton was visualized with TRITC-phalloidin.
Figure 1.
Figure 1.
c-Abl activity contributes to cell spreading. (A) Double knock out cells (Abl−/− Arg−/−) reconstituted with vector (left) or c-Abl (right) were detached, held in suspension 45 min, then plated onto a fibronectin-coated surface for 20 min. Cells were fixed and stained with TRITC-conjugated phalloidin to visualize the F-actin cytoskeleton. (B) Cells were treated as in A except they were fixed at 35 min after plating onto fibronectin and αvinculin/α-mouse Texas red (Sigma-Aldrich) was used for staining to visualize focal contacts. (C) Double knock out cells reconstituted with vector (top) or c-Abl (bottom) were pretreated with either the vehicle control, DMSO (left) or 3 μM STI571 (right). In the continued presence of DMSO or STI571 cells were detached, held in suspension for 45 min, and replated onto a fibronectin-coated surface for 30 min. Fixed cells were stained with FITC-conjugated phalloidin. (D) Src knock out cells (Src−/−) reconstituted with vector (top left) or c-Src (top right) were detached and spread onto a fibronectin-coated surface, then stained as in A. The indicated cells were pretreated with 3 μM STI571 or 1 μM SU6656 (middle). Bottom panels show 293T cells overexpressing activated Src(Y529F). 24 h after transfection cells were pretreated with DMSO (left) or STI571 (right). Cells were detached and replated onto fibronectin as in A. Transfected cells were located by staining with αSrc/FITC-αmouse, and the actin cytoskeleton was visualized with TRITC-phalloidin.
Figure 2.
Figure 2.
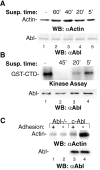
Association of c-Abl with the F-actin cytoskeleton in detached cells. (A) c-Abl was immunoprecipitated (αFLAG-M2; Sigma-Aldrich) from c-Abl–reconstituted Abl−/− fibroblasts that were held in suspension for the indicated time (lanes 2–5) or reattached onto a fibronectin coated surface (lane 1). Immunoprecipitates were examined for quantity of associated actin by immunoblotting (αactin, Sigma-Aldrich; α8E9, BD PharMingen). (B) Performed as in A, immunoprecipitations were analyzed for c-Abl kinase activity using glutathione S-transferase (GST)–COOH-terminal domain (CTD) of RNA polymerase II as a specific Abl substrate (Baskaran et al., 1993, 1996; Gong et al., 1999; Woodring et al., 2001). (C) As a control, we performed immunoprecipitations from vector reconstituted Abl−/− fibroblasts (lanes 1 and 2) versus c-Abl reconstituted (lanes 3 and 4). Fibroblasts were held in suspension for 45 min and immunoprecipitation was as in A.
Figure 3.
Figure 3.
Localization of c-Abl and F-actin in attached and detached c-Abl–reconstituted Abl−/− fibroblasts. (A) Confocal images of attached (left) and detached cells (right). c-Abl–reconstituted knock out cells were detached then either replated onto fibronectin-coated coverslips or held in suspension for 45 min. Adherent cells were fixed attached to the coverslip and detached cells were fixed in suspension. Cells were stained with α8E9/αmouse Texas red and FITC-conjugated phalloidin to visualize c-Abl and F-actin respectively. Vertical plane of focus is near the top surface of cells. (B) Deconvolution images of individual detached cells. Vertical plane of focus is near the cell center for Abl staining. The antibody used for staining (in combination with Texas red secondary antibody) is indicated on the right. FITC-conjugated phalloidin and Hoechst were used to stain F-actin and the nucleus, respectively.
Figure 4.
Figure 4.
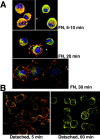
Localization of c-Abl and F-actin in spreading NIH3T3 fibroblasts. (A) NIH3T3 cells were detached, held in suspension for 40 min then reattached to a fibronectin-coated surface. Cells were fixed at the indicated times and stained with TRITC-conjugated phalloidin and α8E9/FITC-αmouse. Arrowheads indicate the F-actin–rich filopodia and lamellipodia apparent in spreading fibroblasts. (B) NIH3T3 cells were detached and held in suspension for either 5 or 60 min. Cells were fixed in suspension then stained as in A.
Figure 5.
Figure 5.
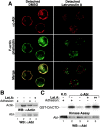
Effect of Latrunculin A on c-Abl association with F-actin and c-Abl activity. (A) Deconvolution images of detached and latrunculin A–treated detached c-Abl–reconstituted Abl−/− cells. 2 h before detachment 1 μM latrunculin A was added to media and was present throughout the suspension incubation of 40 min. Reagents used in cell staining are as indicated on the left. Vertical plane of focus is near top surface of cells. (B) c-Abl was immunoprecipitated from c-Abl reconstituted Abl−/− fibroblasts which were either detached (lane 2), fibronectin reattached (lane 3), or detached and treated with 1 μM latrunculin (lane 4) as described in A. Abl−/− cells were used as the negative control (lane 1). αactin (Sigma-Aldrich) immunoblotting and αAbl (8E9) immunoblotting of the membranes containing c-Abl immunoprecipitates are shown in the top and bottom panels, respectively. (C) c-Abl was immunoprecipitated from c-Abl reconstituted Abl−/− fibroblasts with αFLAGM2 to measure kinase activity. GST-CrkCTD was used as the Abl substrate in kinase reactions (Gong et al., 1999; Woodring et al., 2001). Latrunculin A treatment was as indicated in A, using concentrations of 0.25 μM (lane 4) or 1 μM (lane 5). DMSO was added to control cells (lanes 1–3).
Figure 6.
Figure 6.
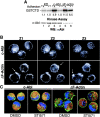
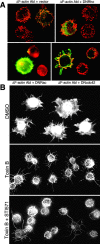
Actin microspikes project from membranes of detached cells expressing ΔF-actin c-Abl. (A) The indicated c-Abl DNA constructs were stably expressed in Abl−/− fibroblasts. Cells were detached from the substratum, then either held in suspension (Adhesion −) or attached to a fibronectin-coated surface (Adhesion +) for 40 min. c-Abl protein was immunoprecipitated (K12 antibody) and assayed for ability to phosphorylate GST-CTD of RNA polymerase II. Top panel shows the 32P autoradiogram obtained after the proteins were transferred to PVDF membrane and exposed to film. Bottom panel shows the immunoblot performed on the same membrane. 8E9 antibody was used to determine the quantity of c-Abl in each immunoprecipitation. The specific activity indicated below autoradiograms is equal to (32P-GST-CTD)/(c-Abl). (B) c-Abl or ΔF-actin c-Abl–reconstituted Abl−/− cells were detached, fixed in suspension, and gently centrifuged onto slides using a cryospin centrifuge. FITC-conjugated phalloidin staining was performed to visualize the F-actin cytoskeleton. Using deconvolution microscopy a Z-series of images was compiled from 0.3-μm interval images obtained along the z-axis (varying up and down the vertical focus). Z2 represents the image obtained at or near the cell center; Z1 and Z3 represent the same image 1.8 μm above and below Z2, respectively. At all optical sections examined we observed differences between the cell membranes of c-Abl versus ΔF-actin-Abl–reconstituted cells. (C) The indicated cells were pretreated with 3 μM STI571 or DMSO control for 8 h previous to cell detachment, then prepared as described in A. Fixed cells were stained with α8E9/αmouse Texas red, FITC-conjugated phalloidin, and Hoechst 33258 to visualize c-Abl, F-actin, and the nucleus, respectively.
Figure 7.
Figure 7.
Effect of dominant negative GTPases on F-actin microspikes stimulated by ΔF-actin–Abl. (A) 293T cells were cotransfected with ΔF-actin–Abl (1 μg) and the indicated dominant negative Rho family GTPase (5 μg). Top panels are stained with α8E9/FITC-αmouse and TRITC-conjugated phalloidin, and successfully transfected cells were stained green for ΔF-actin–Abl. Bottom panels are stained with αRac/FITC-αmouse (left) and αCdc42/FITC-αrabbit, to detect successfully transfected cells, and with TRITC-conjugated phalloidin. (B) DKO+c-Abl cells were pretreated overnight with DMSO, 4 ng/ml Toxin B or 3 μM STI571 + 4 ng/ml Toxin B as indicated. Cells were detached, held in suspension for 45 min, then reattached onto fibronectin coated coverslips in the continued presence of drugs. 20 min after replating, cells were fixed and stained with TRITC-conjugated phalloidin.
Figure 8.
Figure 8.
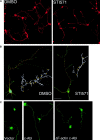
Effects of STI571 and expression of ΔF-actin c-Abl on the F-actin cytoskeleton of rat embryonic cortical neurons. (A and B) Dissociated rat E18 cortical neurons were plated onto coverslips and grown in the presence of either DMSO or 3 μM STI571 for 48 h before fixation. Fixed neurons were stained with TRITC-phalloidin (A) or αneurofilament/αrabbit-Texas red and FITC-conjugated phalloidin (B). The enlargement of a portion of the neurite in B is the phalloidin stain only. (C) Neurons were transfected 18 h after plating onto coverslips. Cotransfections were performed using Lipofectamine 2000. Left, GFP + vector; middle, GFP + c-Abl; right, GFP+ ΔF-actin c-Abl. Each panel shows two representative transfected neurons. (D) Quantification of the data provided in A and C. Neurite branches were defined as ≥2 μm F-actin protrusions present on the longest neurite of neurons. Values reported are the percentage of total neurons examined for one of three representative experiments; average reported (top right inset) is the average number of branches per 10 μm of axon length. Top, n = 131 neurons for DMSO; n = 153 neurons for STI571; asterisk indicates a P < 0.01, z-test. Bottom, after 12 h in culture, rat E18 cortical neurons were cotransfected with GFP DNA and the indicated c-Abl DNA. Transfected neurons were grown for an additional 48 h then stained with TRITC-phalloidin. n = 20 neurons for each transfection; asterisk indicates P < 0.01 compared with wild-type c-Abl, Student's t test.
Figure 8.
Figure 8.
Effects of STI571 and expression of ΔF-actin c-Abl on the F-actin cytoskeleton of rat embryonic cortical neurons. (A and B) Dissociated rat E18 cortical neurons were plated onto coverslips and grown in the presence of either DMSO or 3 μM STI571 for 48 h before fixation. Fixed neurons were stained with TRITC-phalloidin (A) or αneurofilament/αrabbit-Texas red and FITC-conjugated phalloidin (B). The enlargement of a portion of the neurite in B is the phalloidin stain only. (C) Neurons were transfected 18 h after plating onto coverslips. Cotransfections were performed using Lipofectamine 2000. Left, GFP + vector; middle, GFP + c-Abl; right, GFP+ ΔF-actin c-Abl. Each panel shows two representative transfected neurons. (D) Quantification of the data provided in A and C. Neurite branches were defined as ≥2 μm F-actin protrusions present on the longest neurite of neurons. Values reported are the percentage of total neurons examined for one of three representative experiments; average reported (top right inset) is the average number of branches per 10 μm of axon length. Top, n = 131 neurons for DMSO; n = 153 neurons for STI571; asterisk indicates a P < 0.01, z-test. Bottom, after 12 h in culture, rat E18 cortical neurons were cotransfected with GFP DNA and the indicated c-Abl DNA. Transfected neurons were grown for an additional 48 h then stained with TRITC-phalloidin. n = 20 neurons for each transfection; asterisk indicates P < 0.01 compared with wild-type c-Abl, Student's t test.

Similar articles

Cited by

References

    1. Bamburg, J. 1999. Proteins of the ADF/cofilin family: essential regulators of actin dynamics. Annu. Rev. Cell Dev. Biol. 15:185–230. - PubMed
    1. Bashaw, G., T. Kidd, D. Murray, T. Pawson, and C. Goodman. 2000. Repulsive axon guidance: Abelson and Enabled play opposing roles downstream of the roundabout receptor. Cell. 101:703–715. - PubMed
    1. Baskaran, R., G.G. Chiang, and J.Y.J. Wang. 1996. Identification of a binding site in c-Abl tyrosine kinase for the C-terminal repeated domain of RNA polymerase II. Mol. Cell. Biol. 16:3361–3369. - PMC - PubMed
    1. Baskaran, R., M. Dahmus, and J.Y.J. Wang. 1993. Tyrosine phosphorylation of mammalian RNA polymerase II carboxyl-terminal domain. Proc. Natl. Acad. Sci. USA. 90:11167–11171. - PMC - PubMed
    1. Bastmeyer, M., and D.D. O'Leary. 1996. Dynamics of target recognition by interstitial axon branching along developing cortical axons. J. Neurosci. 16:1450–1459. - PMC - PubMed

Publication types

MeSH terms