. 2002 Feb 19;99(4):2118-23.
doi: 10.1073/pnas.251687398.

Analysis of DNA microarrays using algorithms that employ rule-based expert knowledge

Affiliations

Analysis of DNA microarrays using algorithms that employ rule-based expert knowledge

Kuang-Hung Pan et al. Proc Natl Acad Sci U S A. .

Abstract

The ability to investigate the transcription of thousands of genes concurrently by using DNA microarrays offers both major scientific opportunities and significant analytical challenges. Here we describe GABRIEL, a rule-based system of computer programs designed to apply domain-specific and procedural knowledge systematically and uniformly for the analysis and interpretation of data from DNA microarrays. GABRIEL'S problem-solving rules direct stereotypical tasks, whereas domain-specific knowledge pertains to gene functions and relationships or to experimental conditions. Additionally, GABRIEL can learn novel rules through genetic algorithms, which define patterns that best match the data being analyzed and can identify groupings in gene expression profiles preordered by chromosomal position or by a nonsupervised algorithm such as hierarchical clustering. GABRIEL subsystems explain the logic that underlies conclusions and provide a graphical interface and interactive platform for the acquisition of new knowledge. The present report compares GABRIEL'S output with published findings in which expert knowledge has been applied post hoc to microarray groupings generated by hierarchical clustering.


Figures

Figure 1
Figure 1
Flow chart and outline of gabriel architecture. The principal gabriel subsystems described in the text are indicated. The consultation module accesses the rule base, which contains both domain knowledge and procedural knowledge, and applies this knowledge to the analysis of data. Core rules included in the rule base have been created by the authors using biological and statistical knowledge; the latter type of knowledge is incorporated into data-quality rules that evaluate the reliability of results and assist users in choosing appropriate parameter settings. The explanation module can indicate to a user which premises of rules were or were not satisfied by a particular gene expression profile (see text). Users can also enter new rules or modify existing ones by using graphical or textual interfaces of the rule acquisition module, and these rules can be stored in the rule base for future analyses. Additionally, the machine learning module of gabriel, which includes the GA pattern-search algorithm and a continuity/gap algorithm, can learn rules directly from the dataset and save them in the rule base.
Figure 2
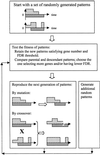
Figure 2
Flow chart representation of pattern searching by gabriel's GA. The examples show profiles of gene expression relative to a specified threshold level over a time course. The dotted areas indicate expression >0 and the crosshatched areas indicate expression <0. The rule generates a set of random profiles and identifies those that correspond to actual profiles in the dataset. The criteria for determining whether a profile will survive are its ability to select a greater number of genes that fit and to concurrently yield an FDR rate below the threshold specified by the user. Profiles satisfying these criteria are retained, and the others are discarded. In the following cycles, surviving profiles undergo random mutation and crossover to generate descendants. Each descendant profile is compared with its parent and the one selecting a larger number of genes having an acceptable FDR. Once a pattern of profiles is stable, i.e., no descendant profile is found that matches the data better than the parental profile, this pattern lineage stops evolving and is stored. Additional randomly generated profiles are searched for additional fits with the data, and the process is repeated. The GA pattern search algorithm terminates its analysis when no new matching patterns can be found in the dataset.
Figure 3
Figure 3
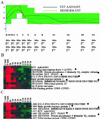
gabriel analyses. (A) Graphical interface showing parameters selected by user for the I/E event response rule. Sampling times during the experiment are designated by using entry boxes and are represented on the x axis. The y axis represents the gene expression level after the base-2 logarithm transformation. Entry boxes allow users to define maximum and minimum thresholds for zones (green region) of expression at each time point; in indicates infinity. Zones defined in this interface are translated by gabriel into a textual representation of the rule. Activation of the search identifies gene expression profiles that satisfy the specified parameters. In this example, the user wants to find genes whose expression is defined to increase gradually from 0.25 h to 1 h after serum addition, reach a peak at 2 h, decrease to the baseline by 6 h, and remain there throughout the duration of the experiment. The black line within the green zone is the profile of an expressed sequence tag (AA016305) selected by this rule but not included in the I/E response gene cluster (cluster E) of Iyer et al. (18). The red line (expressed sequence tag SID381836), which was included in cluster E, falls outside the defined parameters (green zone) at the one- and two-time points and was not selected by this gabriel rule. (B) Genes identified by the rule defined by parameters shown in A. The display style follows that of Eisen et al. (41): log ratios of 0 (unchanged) are shown as black, positive ratios (up-regulation) are represented by red, and negative ratios (down-regulation) are represented by green. The intensity is increased to correspond to the experimentally determined ratios. Genes common to the I/E response cluster E in figure 2 of Iyer et al. (18) are designated by *. The FDR was calculated by random permutation rule by randomly shuffling the expression level at different time points more than 100 times and used to estimate the statistical probability (0.3 in this case) of spurious assignment of a profile to a defined pattern. (C) Genes identified by a c-fos proband-based rule. The c-fos gene was designated as proband, and 0.8 correlation coefficient over 11 time points was the specified threshold. Genes were sorted according to their correlation coefficient (the first numbers on each row) with c-fos. Including c-fos, five of the genes selected by gabriel (designated by *) were in cluster E, a seven-gene c-fos-containing hierarchical cluster chosen by Iyer et al.
Figure 4
Figure 4
Application of the continuity/gap and GA rules. (A) Continuities identified by continuity/gap algorithm. (Upper) Shown is a continuity that includes seven genes that had been assigned to cluster E by Iyer et al. (Lower) All components of the continuity, which contains junB, were included in cluster J by Iyer et al. Additional profiles in cluster J were not selected by this gabriel rule because they did not have a correlation coefficient higher than the threshold specified for the continuity. (B) Examples of patterns identified by GA-based pattern search rule (Fig. 2). In this application of GA pattern search rule, each pattern was required to include at least three genes and have a FDR of less than 0.2. Patterns 1 and 2 were generated randomly and found by gabriel to fit closely with expression profiles in the dataset. Pattern 1 corresponds to the I/E grouping defined by the parameters shown in Fig. 3A (i.e., serum-induced expression not sustained for an extended period). Pattern 2 corresponds to an I/E response with sustained high expression level. Age represents the number of generations that GA algorithm used to evolve the patterns. The ages of patterns 1 and 2 are 31. The FDR was estimated from the random permutation rule; in indicates infinity.

Similar articles

Cited by

References

    1. Quackenbush J. Nat Rev Genet. 2001;2:418–427. - PubMed
    1. Sherlock G. Curr Opin Immunol. 2000;12:201–205. - PubMed
    1. Brazma A, Vilo J. FEBS Lett. 2000;480:17–24. - PubMed
    1. Brown M P, Grundy W N, Lin D, Cristianini N, Sugnet C W, Furey T S, Ares M, Jr, Haussler D. Proc Natl Acad Sci USA. 2000;97:262–267. - PMC - PubMed
    1. Furey T S, Cristianini N, Duffy N, Bednarski D W, Schummer M, Haussler D. Bioinformatics. 2000;16:906–914. - PubMed

Publication types

Substances

LinkOut - more resources