. 2002 Feb 5;99(3):1665-70.
doi: 10.1073/pnas.032541099. Epub 2002 Jan 22.

C2A activates a cryptic Ca(2+)-triggered membrane penetration activity within the C2B domain of synaptotagmin I

Affiliations

C2A activates a cryptic Ca(2+)-triggered membrane penetration activity within the C2B domain of synaptotagmin I

Jihong Bai et al. Proc Natl Acad Sci U S A. .

Abstract

Synaptotagmin (syt) I, an integral membrane protein localized to secretory vesicles, is a putative Ca(2+) sensor for exocytosis. Its N terminus spans the membrane once, and its cytoplasmic domain contains two conserved C2 domains, designated C2A and C2B. The isolated C2A domain penetrates membranes in response to Ca(2+); isolated C2B does not. Here, we have addressed the function of each C2 domain, but in the context of the intact cytoplasmic domain (C2A-C2B), by using fluorescent reporters placed in the Ca(2+)-binding loops of either C2A or C2B. Surprisingly, these reporters revealed that, analogous to C2A, a Ca(2+)-binding loop in C2B directly penetrates into lipid bilayers. Penetration of each C2 domain was very rapid (k(on) approximately 10(10) M(-1) x s(-1)) and resulted in high affinity C2A-C2B-liposome complexes (K(d) approximately 13-14 nM). C2B-bilayer penetration strictly depended on the presence, but not the membrane binding activity, of an adjacent C2A domain, severing C2A from C2B after protein synthesis abolished the ability of C2B to dip into bilayers in response to Ca(2+). The activation of C2B by C2A was also displayed by the C2 domains of syt III but not the C2 domains of syt IV. A number of proteins contain more than one C2 domain; the findings reported here suggest these domains may harbor cryptic activities that are not detected when they are studied in isolation.


Figures
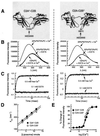
Figure 1
Figure 1
AEDANS reporters indicate that both C2 domains of syt I interact rapidly with membranes. (A) Molecular models depicting the labeling sites in the cytoplasmic domain of syt I (designated C2A-C2B). The fluorophore, IAEDANS, was used to label the thiol side chains of the lone Cys residues engineered into Ca2+-binding loop 3 of C2A or C2B. The label is indicated by *; C2A*-C2B harbors an AEDANS reporter labeled in the C2A domain (F234C); C2A-C2B* harbors an AEDANS reporter labeled in the C2B domain (I367C). These labels are shown by using the crystal structure of syt III (20) as a template; images were rendered by using WebLab VIEWERLITE 3.7 software. (B) Ca2+/liposome-dependent changes in the fluorescence of C2A*-C2B and C2A-C2B*. C2A*-C2B and C2A-C2B* were adjusted to 0.5 μM in Hepes and excited at 336 nm; the emission spectra were then collected from 420 to 600 nm. Spectra were first obtained in the presence of 0.1 mM EGTA and liposomes. Liposome composition (25% PS/75% PC) and concentration (11 nM liposomes, 1 mM total lipid) are the same for all experiments unless otherwise indicated. Ca2+ was then added to a final free concentration of 0.5 mM. In the presence of Ca2+ and liposomes, both C2A*-C2B and C2A-C2B* showed large increases in fluorescence intensity (71.8% and 77.8% for C2A*-C2B and C2A-C2B*, compared with the intensity in EGTA at 474 nm) and exhibited significant blue shifts (for C2A*-C2B, from 500 nm to 476 nm; for C2A-C2B*, from 502 nm to 474 nm) in their emission maxima (solid lines). Identical amounts of liposomes lacking anionic phospholipids (100% PC) did not induce fluorescence changes in the presence or absence of Ca2+ (dashed lines). (C) Stopped-flow mixing experiments demonstrate that the reporters in C2A*-C2B and C2A-C2B* rapidly penetrate membranes with similar kinetics. The fluorescence changes exhibited by C2A*-C2B or C2A-C2B* were used to monitor the kinetics of Ca2+-triggered interactions with liposomes, using an Applied Photophysics SX.18MV stopped-flow spectrometer. (Left) C2A*-C2B (1 μM) was premixed with liposomes (22 nM) and EGTA (0.1 mM), and then rapidly mixed with Ca2+ (0.5 mM final free [Ca2+]). The kinetics of this reaction are shown in the upper trace. As a control, mixing experiments were also carried out by using 0.1 mM EGTA instead of Ca2+ (lower trace), providing a minimum reference point. Data (4,000 points) were collected for 100 ms and are plotted with a best-fit single exponential function (kobs = 257 s−1). (Right) The same experiment was carried out, except using C2A-C2B* (kobs = 247 s−1). (D) Determination of kon and koff for the C2A*-C2B or C2A-C2B*⋅liposome complexes in the presence of Ca2+. Stopped-flow rapid mixing experiments were carried out as in C; kobs was determined by fitting the data with single exponential functions and plotted vs. [liposome]. The Y-intercept yields koff for the C2A*-C2B⋅liposome complex in the presence of Ca2+ (146.6 ± 6.9 s−1), and the slope yields kon (1.06 ± 0.09 × 10¹⁰ M−1⋅s−1) (10). Almost identical data were obtained for the cryptic lipid penetration activity of C2B, as revealed by analysis of C2A-C2B*; koff was 134.6 ± 9.3 s−1 and kon was 1.07 ± 0.12 × 10¹⁰ M−1⋅s−1. Error bars represent standard deviations from three independent experiments. In Ca2+, the dissociation constant for the C2A-C2B⋅liposome complex was ≈13–14 nM. (E) Steady-state Ca2+ dependency of C2A*-C2B and C2A-C2B* penetration into liposomes. The corrected emission spectra were obtained as described in B and integrated. The changes in fluorescence intensity were normalized, plotted, and fit as a function of [Ca2+]free with GRAPHPAD PRISM 2.0 software. For C2A*-C2B (●), the [Ca2+]1/2 was 69 ± 1.3 μM (Hill coefficient = 2.3); for C2A-C2B* (○), the [Ca2+]1/2 was 53 ± 1.4 μM (Hill coefficient = 3.2).
Figure 2
Figure 2
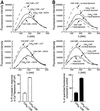
Ca2+ binding loop 3 in the C2A and C2B domains of C2A-C2B penetrate lipid bilayers to the same extent. (A) Membrane-embedded quenchers efficiently quench the fluorescent reporters in both C2A*-C2B and C2A-C2B*. For these experiments, 0.5 μM AEDANS-labeled protein was incubated with liposomes in the presence of 0.5 mM Ca2+. Liposomes contained 25% PS, 65% PC, and 10% doxyl-PC labeled at the 5-, 7-, or 12-position of the sn-2 acyl chain. The depth of penetration was calculated as described in Materials and Methods. The distance between the fluorophore and bilayer center was 10.5 ± 0.7 Å and 10.6 ± 0.6 Å for the reporters in C2A*-C2B and C2A-C2B*, respectively. Thus, loop 3 of both C2A and C2B penetrate about one-sixth into the hydrophobic core of the lipid bilayer. (B) A model depicting the Ca2+-triggered docking of C2A-C2B onto a lipid bilayer. The crystal structure of C2A-C2B was modified from Sutton et al. (20). (Right) Three cyan stars indicate doxyl quenchers labeled at the 5-, 7-, or 12-position of the sn-2 acyl chain of PC. The pink star indicates the AEDANS fluorophore attached to a Cys residue (green) engineered into Ca2+-binding loop 3 (red) of either C2A or C2B.
Figure 3
Figure 3
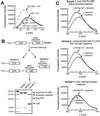
C2A does not drag the C2B domain of C2A-C2B into membranes. In the context of C2A-C2B, neutralization of Ca2+ ligands (D230,232N) in the C2A domain significantly disrupts C2A–membrane interactions, but has little effect on C2B–membrane interactions. These experiments were carried out two ways. (A) Fluorescence spectra were obtained as described in Fig. 1B. The Ca2+ (0.5 mM)/liposome-triggered fluorescence increases were used as indicators of membrane penetration. The fluorescence spectra of C2A*-C2B is indicated with dashed lines. The fluorescence spectra of C2AM*-C2B or C2AM-C2B* [the subscript M refers to two Ca2+-ligand mutations (D230,232N) that disrupt Ca2+-triggered C2A–lipid interactions] (22) are indicated with solid lines. All samples contained anionic phospholipid liposomes. (Top) As a control, the fluorescence of C2A*-C2B in EGTA (0.1 mM) increases upon addition of Ca2+ (0.5 mM). This increase was attenuated in C2AM*-C2B. (Middle) This experiment was repeated by using C2A-C2B* as a positive control. As expected, Ca2+ drove increases in emission intensity of the reporter. This increase was only slightly attenuated when C2AM-C2B* was analyzed. (Bottom) The Ca2+-triggered increases in emission intensity for C2AM*-C2B and C2AM-C2B* were quantified and plotted. These values were obtained by normalizing the fluorescence intensity (FI) changes of C2AM*-C2B and C2AM-C2B* (ΔF′) to those of C2A*-C2B and C2A-C2B* (ΔF), respectively. (B) The extent of AEDANS fluorescence quenching obtained in the presence of Ca2+ (0.5 mM) and liposomes containing 10% membrane-embedded quencher (10% 7-doxyl PC/65% PC/25% PS) were used to quantify membrane penetration. (Top) C2A*-C2B served as a positive control; its emission spectra were efficiently quenched by the presence of the doxyl spin label (dashed lines). These data were compared with the fluorescence spectra of C2AM*-C2B, which showed a diminished degree of quenching (solid lines). (Middle) These experiments were repeated using the C2AM-C2B* version of syt. C2A-C2B* served as a positive control and was efficiently quenched by the doxyl spin label (dashed lines). C2AM-C2B* was quenched to a similar degree (solid lines) as C2A-C2B*, demonstrating that the ability of C2B to penetrate bilayers does not depend on the ability of the adjacent C2A domain to penetrate membranes. (Bottom) The degree of quenching of C2AM*-C2B and C2AM-C2B* are plotted as the fraction of quenched fluorescence to the C2A*-C2B and C2A-C2B* controls, respectively.
Figure 4
Figure 4
The ability of C2B to penetrate bilayers strictly depends on the presence of an adjacent C2A domain. (A) The isolated recombinant C2B domain does not penetrate into lipid bilayers. Fluorescence spectra were recorded as described in Fig. 1B; all samples contained acidic liposomes. C2A-C2B* (in 0.1 mM EGTA) served as a positive control and exhibited an increase in fluorescence upon addition of Ca2+ (0.5 mM). In contrast, isolated C2B, with the same fluorophore placed in the same position (residue 367), did not report significant changes in the presence of Ca2+ (0.5 mM)/liposomes or EGTA (0.1 mM)/liposomes. (B) Scheme showing the separation and purification of C2B* generated from C2A-C2B*. A His-6-tagged version of the cytoplasmic domain of syt, which contains a thrombin cleavage site (indicated as TC) between the C2A and C2B domains, was generated as described in Materials and Methods. This protein, his6-C2A-TC-C2B, was purified by using Ni-NTA-agarose beads. One-half of the protein immobilized on beads was eluted by using 400 mM imidazole and was designated as sample 1. Five units of thrombin was added to the other half of the bead-immobilized protein and incubated overnight at 4°C, after which the supernatant was collected and designated as sample 3. Cleavage was inefficient, and uncleaved material was eluted from the beads by first washing away the thrombin with 8 mM imidazole, followed by elution with 400 mM imidazole; this elute was designated as sample 2. Samples 1, 2, and 3 were labeled by IAEDANS as described in Materials and Methods, subjected to SDS/PAGE, and stained with Coomassie blue. The gel is shown in B (Lower). The identity of the proteins on the gel were confirmed by immunoblotting by using antibodies directed against the C2A or C2B domains of the protein (data not shown). In summary, sample 1 is his6-C2A-C2B* before thrombin treatment; sample 2 is his6-C2A-C2B* after thrombin treatment (as only 3% of the protein was cleaved, this sample is largely unchanged); and sample 3 contains C2B* that was liberated from his6-C2A-TC-C2B by thrombin treatment. (C) Removal of the C2A domain disrupts C2B–membrane interactions. The ability of the C2B* domains from samples 1, 2, and 3 (from B above) to interact with membranes was carried out as described in Fig. 1B. The fluorescence spectra obtained from samples 1, 2, and 3 are shown in Top, Middle, and Bottom, respectively (all samples contained equal molar protein, 0.5 μM). Thus, an adjacent C2A domain is essential for the Ca2+-dependent membrane penetration activity of the C2B domain.
Figure 5
Figure 5
Syt IV lacks cryptic membrane binding activity within its C2B domain. (Upper) Schematic representations of syt constructs. Regions of isoform I (open rectangles), III (shaded rectangles), or IV (black rectangles) are indicated, as are point mutations that disrupt Ca2+ and membrane-binding activity within the C2A domains of isoforms I and III (designated C2AM; corresponding to D230,232N and D385,387N in syts I and III, respectively). In syt IV, a serine residue is present at position 244; this serine abolishes Ca2+-triggered membrane-binding activity of the isolated C2A domain of the protein and is indicated. (Lower) Six micrograms of glutathione S-transferase-fused versions of the proteins shown (Upper) was immobilized on glutathione-Sepharose beads. 3H-labeled 25% PS/75% PC liposome-binding assays were carried out as described in Materials and Methods. In these experiments, C2AM I-C2B I and C2AM III-C2B III served as positive controls (13), and, as reported previously, C2A IV-C2B IV failed to bind liposomes (32). C2AM III, but not C2AM IV, activates the liposome-binding activity of C2B I. Furthermore, C2AM I activates the liposome-binding activity of C2B III but not that of C2B IV. These data reveal that the C2A domain of syt IV cannot activate the C2B domain of syt I and that the C2B domain of syt IV cannot be activated by the C2A of syt I.

Similar articles

Cited by

References

    1. Augustine G J. Curr Opin Neurobiol. 2001;11:320–326. - PubMed
    1. Brose N, Petrenko A G, Südhof T C, Jahn R. Science. 1992;256:1021–1025. - PubMed
    1. Littleton J T, Bai J, Vyas B, Desai R, Baltus A E, Garment M B, Carlson S D, Ganetzky B, Chapman E R. J Neurosci. 2001;21:1421–1433. - PMC - PubMed
    1. Fernandez-Chacon R, Konigstorfer A, Gerber S H, Garcia J, Matos M F, Stevens C F, Brose N, Rizo J, Rosenmund C, Südhof T C. Nature (London) 2001;410:41–49. - PubMed
    1. Perin M S, Fried V A, Mignery G A, Jahn R, Südhof T C. Nature (London) 1990;345:260–263. - PubMed

Publication types

MeSH terms

LinkOut - more resources