

Statistical potentials for fold assessment
- PMID: 11790853
- PMCID: PMC2373452
- DOI: 10.1002/pro.110430
Statistical potentials for fold assessment
Abstract
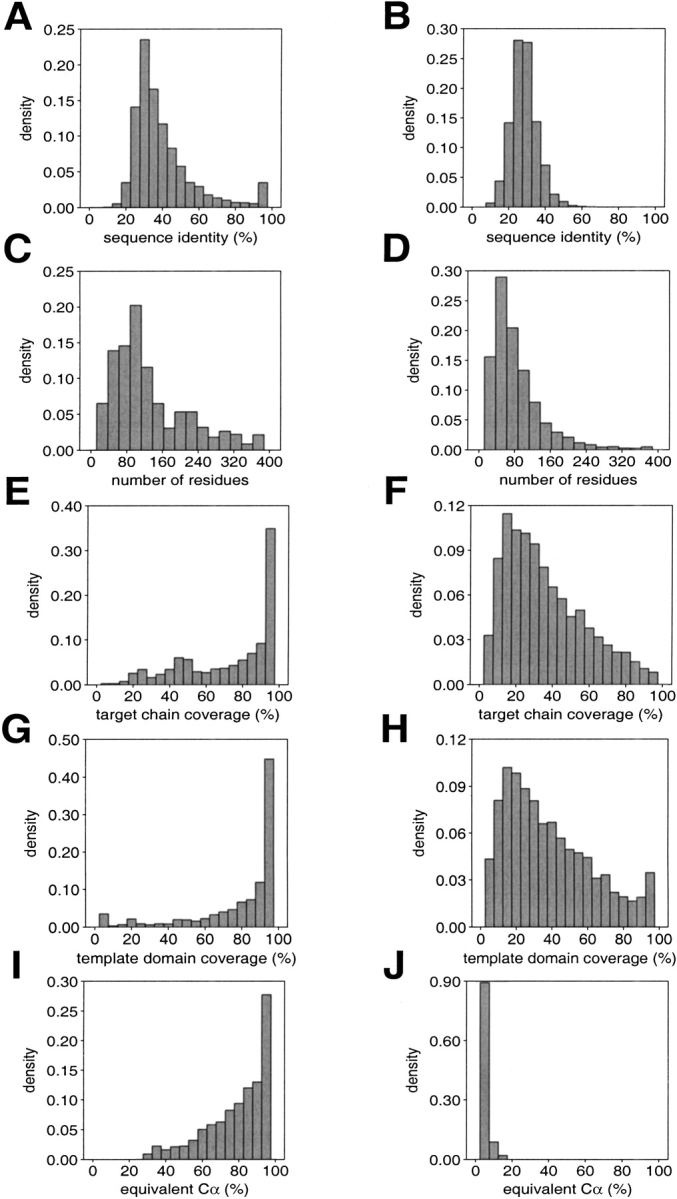
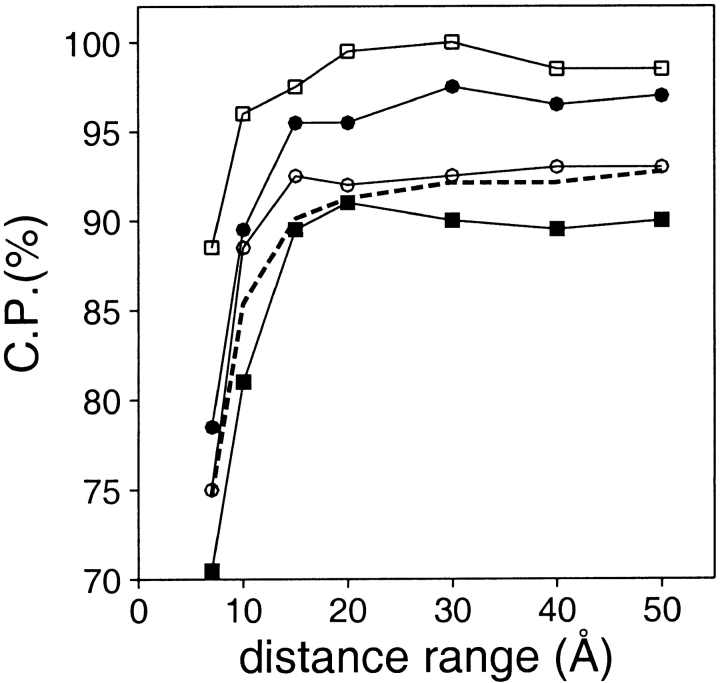
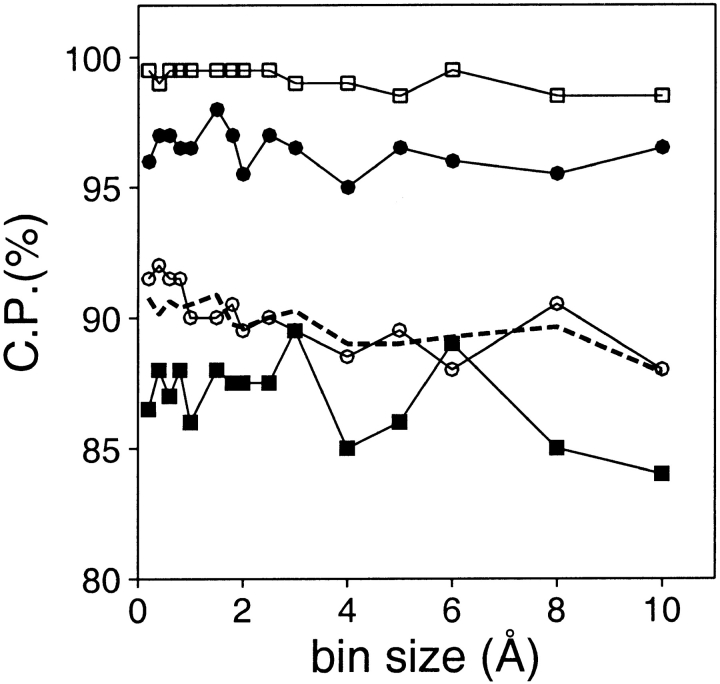
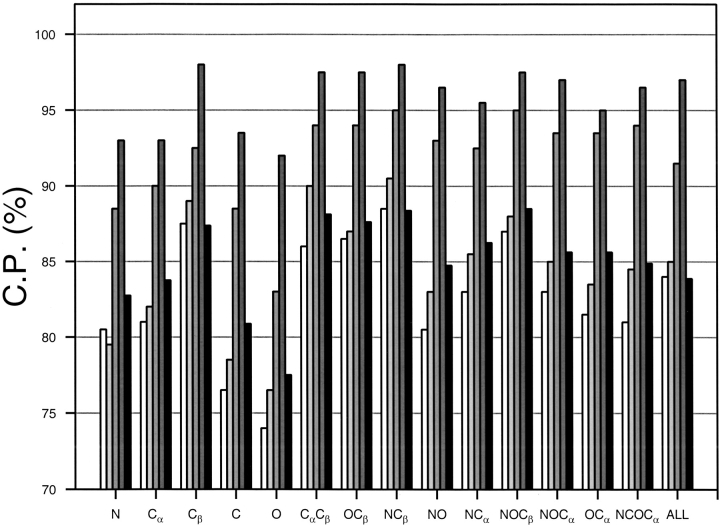
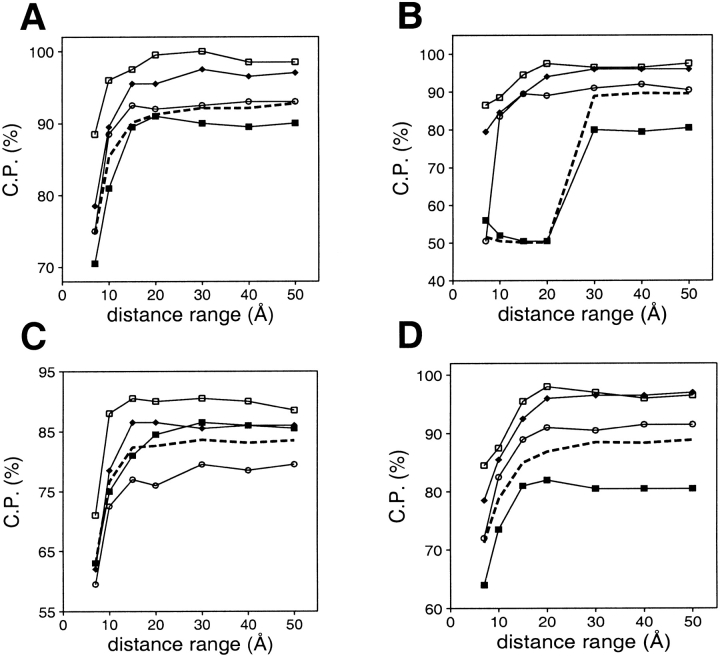
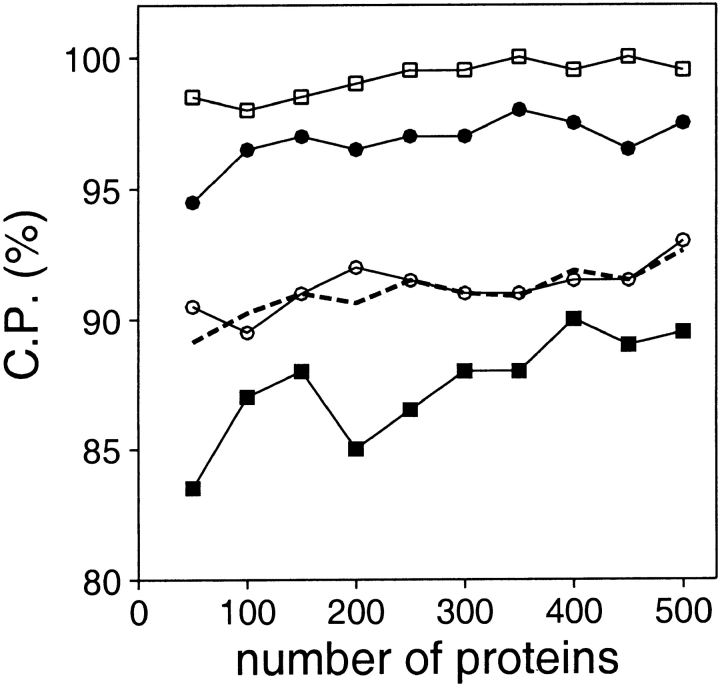
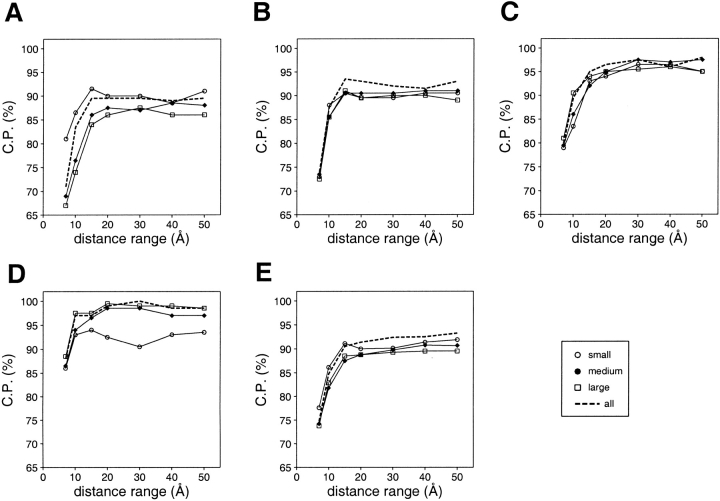
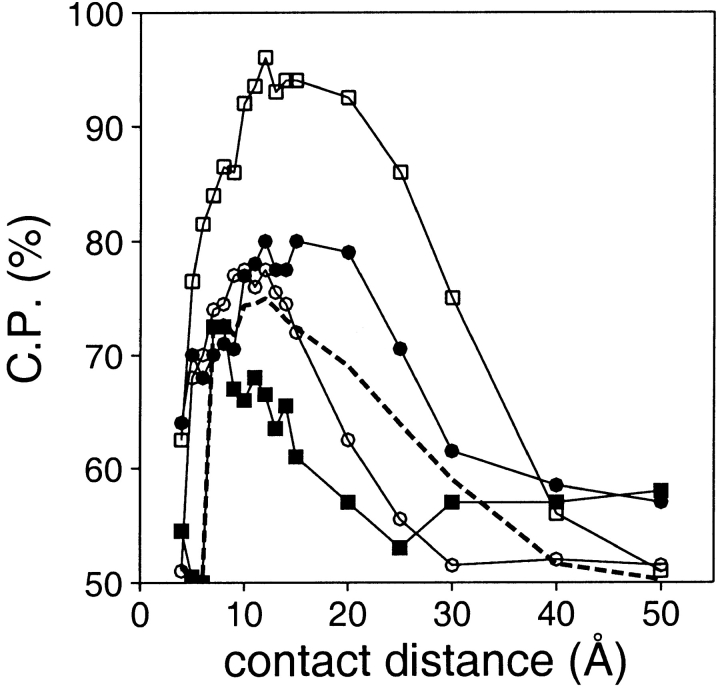
A protein structure model generally needs to be evaluated to assess whether or not it has the correct fold. To improve fold assessment, four types of a residue-level statistical potential were optimized, including distance-dependent, contact, Phi/Psi dihedral angle, and accessible surface statistical potentials. Approximately 10,000 test models with the correct and incorrect folds were built by automated comparative modeling of protein sequences of known structure. The criterion used to discriminate between the correct and incorrect models was the Z-score of the model energy. The performance of a Z-score was determined as a function of many variables in the derivation and use of the corresponding statistical potential. The performance was measured by the fractions of the correctly and incorrectly assessed test models. The most discriminating combination of any one of the four tested potentials is the sum of the normalized distance-dependent and accessible surface potentials. The distance-dependent potential that is optimal for assessing models of all sizes uses both C(alpha) and C(beta) atoms as interaction centers, distinguishes between all 20 standard residue types, has the distance range of 30 A, and is derived and used by taking into account the sequence separation of the interacting atom pairs. The terms for the sequentially local interactions are significantly less informative than those for the sequentially nonlocal interactions. The accessible surface potential that is optimal for assessing models of all sizes uses C(beta) atoms as interaction centers and distinguishes between all 20 standard residue types. The performance of the tested statistical potentials is not likely to improve significantly with an increase in the number of known protein structures used in their derivation. The parameters of fold assessment whose optimal values vary significantly with model size include the size of the known protein structures used to derive the potential and the distance range of the accessible surface potential. Fold assessment by statistical potentials is most difficult for the very small models. This difficulty presents a challenge to fold assessment in large-scale comparative modeling, which produces many small and incomplete models. The results described in this study provide a basis for an optimal use of statistical potentials in fold assessment.
Figures
Similar articles
-
Factors influencing the ability of knowledge-based potentials to identify native sequence-structure matches.J Mol Biol. 1994 Feb 4;235(5):1598-613. doi: 10.1006/jmbi.1994.1109. J Mol Biol. 1994. PMID: 8107094
-
Novel knowledge-based mean force potential at the profile level.BMC Bioinformatics. 2006 Jun 27;7:324. doi: 10.1186/1471-2105-7-324. BMC Bioinformatics. 2006. PMID: 16803615 Free PMC article.
-
Statistical significance of hierarchical multi-body potentials based on Delaunay tessellation and their application in sequence-structure alignment.Protein Sci. 1997 Jul;6(7):1467-81. doi: 10.1002/pro.5560060711. Protein Sci. 1997. PMID: 9232648 Free PMC article.
-
Atomic environment energies in proteins defined from statistics of accessible and contact surface areas.J Mol Biol. 1995 Jun 9;249(3):675-90. doi: 10.1006/jmbi.1995.0328. J Mol Biol. 1995. PMID: 7783220 Review.
-
Knowledge-based potentials--back to the roots.Biochemistry (Mosc). 1998 Mar;63(3):247-52. Biochemistry (Mosc). 1998. PMID: 9526121 Review.
Cited by
-
Putative circumsporozoite protein (CSP) of Plasmodium vivax is considerably distinct from the well-known CSP and plays a role in the protein ubiquitination pathway.Gene X. 2019 Nov 12;4:100024. doi: 10.1016/j.gene.2019.100024. eCollection 2019 Dec. Gene X. 2019. PMID: 32550551 Free PMC article.
-
Reduced C(beta) statistical potentials can outperform all-atom potentials in decoy identification.Protein Sci. 2007 Oct;16(10):2123-39. doi: 10.1110/ps.072939707. Protein Sci. 2007. PMID: 17893359 Free PMC article.
-
Fold assessment for comparative protein structure modeling.Protein Sci. 2007 Nov;16(11):2412-26. doi: 10.1110/ps.072895107. Epub 2007 Sep 28. Protein Sci. 2007. PMID: 17905832 Free PMC article.
-
Four distances between pairs of amino acids provide a precise description of their interaction.PLoS Comput Biol. 2009 Aug;5(8):e1000470. doi: 10.1371/journal.pcbi.1000470. Epub 2009 Aug 14. PLoS Comput Biol. 2009. PMID: 19680437 Free PMC article.
-
Biochemical and structural characterization of tyrosine aminotransferase suggests broad substrate specificity and a two-state folding mechanism in Leishmania donovani.FEBS Open Bio. 2019 Oct;9(10):1769-1783. doi: 10.1002/2211-5463.12715. Epub 2019 Aug 31. FEBS Open Bio. 2019. PMID: 31393078 Free PMC article.
References
-
- Abagyan, R. and Totrov, M. 1997. Contact area difference (CAD): A robust measure to evaluate accuracy of protein models. J. Mol. Biol. 268 678–685. - PubMed
-
- Altschul, S. 1998. Generalized affine gap costs for protein sequence alignment. Proteins 32 88–96. - PubMed
-
- Bahar, I. and Jernigan, R. 1997. Inter-residue potentials in globular proteins and the dominance of highly specific hydrophilic interactions at close separation. J. Mol. Biol. 266 195–214. - PubMed
-
- Baker, D. and Sali, A. 2001. Protein structure modeling and structural genomics. Science 294 93–96. - PubMed
-
- Bauer, A. and Beyer, A. 1994. An improved pair potential to recognize native protein folds. Proteins 18 254–261. - PubMed
Publication types
MeSH terms
Substances
Grants and funding
LinkOut - more resources
Full Text Sources
Other Literature Sources
Medical
