. 2002 Feb;22(3):801-15.
doi: 10.1128/MCB.22.3.801-815.2002.

Removal of a single alpha-tubulin gene intron suppresses cell cycle arrest phenotypes of splicing factor mutations in Saccharomyces cerevisiae

Affiliations

Removal of a single alpha-tubulin gene intron suppresses cell cycle arrest phenotypes of splicing factor mutations in Saccharomyces cerevisiae

C Geoffrey Burns et al. Mol Cell Biol. 2002 Feb.

Abstract

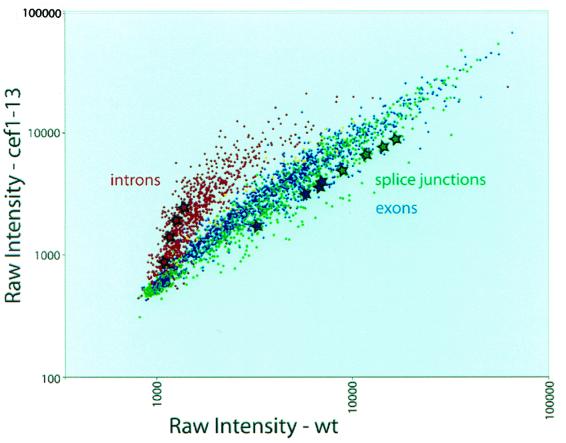
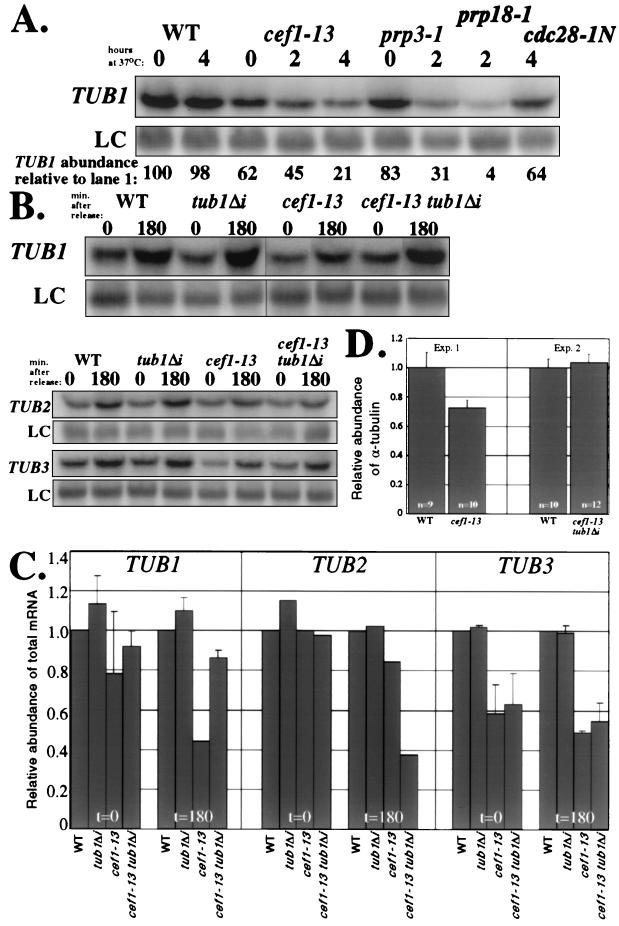
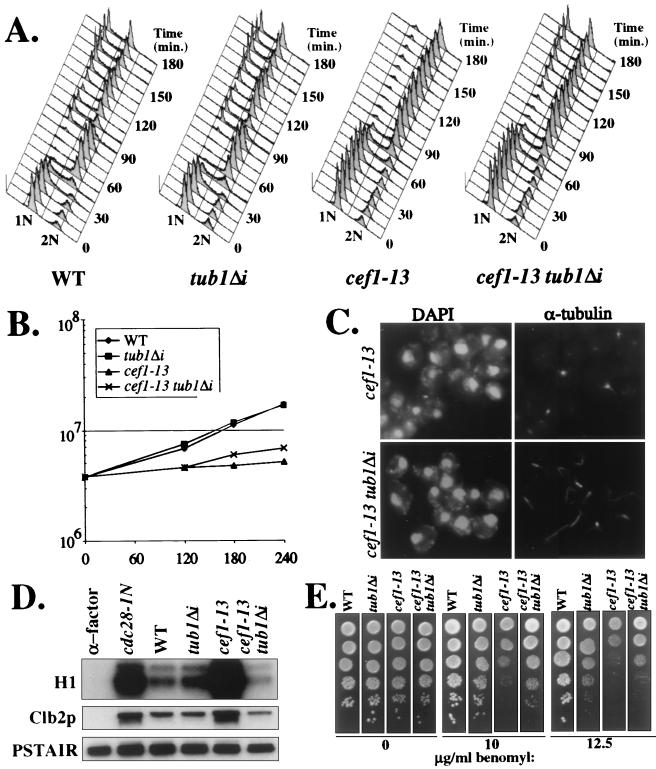
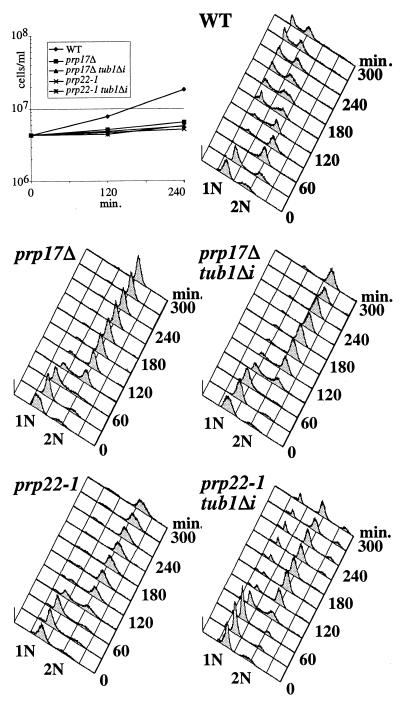
Genetic and biochemical studies of Schizosaccharomyces pombe and Saccharomyces cerevisiae have identified gene products that play essential functions in both pre-mRNA splicing and cell cycle control. Among these are the conserved, Myb-related CDC5 (also known as Cef1p in S. cerevisiae) proteins. The mechanism by which loss of CDC5/Cef1p function causes both splicing and cell cycle defects has been unclear. Here we provide evidence that cell cycle arrest in a new temperature-sensitive CEF1 mutant, cef1-13, is an indirect consequence of defects in pre-mRNA splicing. Although cef1-13 cells harbor global defects in pre-mRNA splicing discovered through intron microarray analysis, inefficient splicing of the alpha-tubulin-encoding TUB1 mRNA was considered as a potential cause of the cef1-13 cell cycle arrest because cef1-13 cells arrest uniformly at G(2)/M with many hallmarks of a defective microtubule cytoskeleton. Consistent with this possibility, cef1-13 cells possess reduced levels of total TUB1 mRNA and alpha-tubulin protein. Removing the intron from TUB1 in cef1-13 cells boosts TUB1 mRNA and alpha-tubulin expression to near wild-type levels and restores microtubule stability in the cef1-13 mutant. As a result, cef1-13 tub1Deltai cells progress through mitosis and their cell cycle arrest phenotype is alleviated. Removing the TUB1 intron from two other splicing mutants that arrest at G(2)/M, prp17Delta and prp22-1 strains, permits nuclear division, but suppression of the cell cycle block is less efficient. Our data raise the possibility that although cell cycle arrest phenotypes in prp mutants can be explained by defects in pre-mRNA splicing, the transcript(s) whose inefficient splicing contributes to cell cycle arrest is likely to be prp mutant dependent.


Figures

FIG. 1.
FIG. 1.
The cef1-13 mutant arrests at G2/M with unstable microtubules. Wild-type (WT) and cef1-13 cells were synchronized in G1 and released to the restrictive temperature. Cell number (A) and fluorescence-activated cell sorter analysis (B) for each strain following release are shown. (C) Staining of microtubules in G2/M-arrested cef1-13 cells. Asynchronous cultures of WT or cef1-13 cells were shifted to the restrictive temperature for 3 h and stained for microtubules using an anti-α-tubulin antibody (TAT-1) (60) followed by an Alexa 594-conjugated secondary antibody. DNA was visualized using DAPI. (D) Electron micrograph analysis of the cef1-13 mutant. An asynchronous culture of cef1-13 cells was shifted to the restrictive temperature for 3 h and processed for electron micrograph analysis by HPS-FS. (Subpanel A) A 50-nm-thin section of an SPB which exhibits a wild-type trilaminar organization. (Subpanel B) Thin section through a short bipolar spindle with both SPBs in the plane of the section. (Subpanels C and D) Two serial semithick (100-nm) sections showing a short bipolar spindle with accompanying involutions of the nuclear membrane. (E) cef1-13 is benomyl sensitive. WT and cef1-13 cells were serially diluted fivefold from a culture at an optical density at 600 nm of 1.0 and spotted onto YPD plates or YPD plates containing the indicated concentrations of benomyl.
FIG. 2.
FIG. 2.
Scatter plot of cef1-13 versus wild-type (wt) splicing microarray data. RNA from the cef1-13 mutant was used as a template for reverse transcription in the presence of Cy5-dUTP, and RNA from wt cells was used as a template in the presence of Cy3-dUTP. The labeled target cDNAs were mixed and hybridized to the oligonucleotide probes on a printed microarray (see Materials and Methods). After washing, the array was scanned and the image analyzed to extract the data. Each point in the plot represents raw intensity data from a single probe spot, with the Cy3 (wt) signal on the abscissa and the Cy5 (mutant) signal on the ordinate. Each probe is present four times on the array. Intron probes (specific to unspliced RNA) are labeled in red, splice junction probes (specific to spliced RNA) are labeled in green, exon probes (representing total gene specific RNA) are labeled in blue, and non-intron-containing gene probes used for normalization are labeled in yellow. The four spots representing each of the TUB1-specific oligonucleotides are labeled with stars. Two factors influence the absolute intensity measurements, so it is important to keep in mind that the Cy5/Cy3 ratio is the key indicator of the difference between mutant and wt. First, different oligonucleotides have distinct hybridization properties, making direct comparison of absolute intensities uninformative. Second, since the identical probe is spotted in different positions on the array, their absolute intensities vary due to local hybridization differences. Note that each set of four identical probes falls in a line, indicating a consistent Cy5/Cy3 ratio measurement.
FIG. 3.
FIG. 3.
cef1-13 cells have less TUB1 mRNA and α-tubulin protein unless the TUB1 intron is deleted. (A) Northern analysis of total TUB1 mRNA abundance in asynchronous cultures shifted to the restrictive temperature. Total RNA was prepared from wild-type (WT), cef1-13, prp3-1, prp18-1, and cdc28-1N cells incubated at the permissive temperature or following shift to the restrictive temperature for the indicated number of hours. The levels of TUB1 mRNA in each sample were quantified by Northern blot analysis using a probe to the entire open reading frame of TUB1. The TUB1 signal in each lane was normalized to that of the non-intron-containing loading control TDH2 (LC) and expressed as a percentage of TUB1 in the first lane. (B) Northern analysis of total TUB1, TUB2, and TUB3 mRNA abundance following synchronization in G1 and release to the restrictive temperature. Total RNA was prepared from WT, tub1Δi, cef1-13, and cef1-13 tub1Δi cells 0 and 180 min following release and blotted with probes for the entire open reading frames for TUB1, TUB2, and TUB3. The non-intron-containing TDH2 transcript was used as an LC. (C) Quantification of Northern analysis shown in panel B. The levels of TUB mRNAs in panel B were normalized to that of the LC TDH2 and expressed as a proportion of lane 1. The relative amounts of each transcript are shown for each strain according to the time point following release from G1. (D) Examination of α-tubulin protein in cef1-13 strains. WT, cef1-13, and cef1-13 tub1Δi cells were synchronized with mating pheromone and released to the restrictive temperature. At 180 min following release, multiple pellets (optical density = 10) were collected. Strains for each experiment were prepared twice. Protein lysates were made from each pellet, and bicinchoninic assays were conducted to allow normalization of protein concentrations between all samples. Equivalent amounts of protein were blotted with an α-tubulin monoclonal antibody (α) and polyclonal antisera raised against TATA-binding protein (encoded by a non-intron-containing gene) as a loading control. The immunoblots were quantitated using a Molecular Dynamics Storm instrument, and the results of α-tubulin protein relative to TATA-binding protein were graphed. The bars indicate the average and standard deviation (error bars). The number of independent analyses for each strain is indicated.
FIG. 4.
FIG. 4.
Removing the intron from TUB1 allows cef1-13 cells to progress through mitosis. Wild-type (WT), tub1Δi, cef1-13, and cef1-13 tub1Δi cells were synchronized in G1 with α-factor and released to the restrictive temperature. Following their release, cultures were monitored for cell number (B) and cell cycle progression as reflected by DNA content (A). (C) At 2 h following release, the status of microtubule structures in cef1-13 and cef1-13 tub1Δi cells was evaluated with indirect immunofluorescence. (D) At 3 h following release, the levels of the mitotic cyclin Clb2p and its associated H1 kinase activity were evaluated. G1-arrested WT cells and G2/M-arrested cdc28-1N cells were used as controls for low and high Clb2p and kinase activity, respectively. G1-arrested cells were obtained by treating WT cells with α-factor. G2/M-arrested cells were obtained by synchronizing cdc28-1N cells with α-factor and releasing them to the restrictive temperature for 3 h. (E) Tenfold serial dilutions of WT, tub1Δi, cef1-13, and cef1-13 tub1Δi cells were spotted on YPD agar with the indicated concentrations of benomyl and incubated at 25°C for 3 days prior to being photographed.
FIG. 5.
FIG. 5.
An extra copy of TUB1 allows cef1-13 cells to progress through mitosis. cef1-13 cells carrying an empty CEN vector or the same vector containing the wild-type TUB1 allele or the intronless tub1Δi allele were synchronized in G1 and released to the restrictive temperature. Released cultures were monitored for cell number (upper left) and cell cycle progression as reflected by DNA content.
FIG. 6.
FIG. 6.
Cell cycle arrest of prp17 and prp22 mutants. Wild-type (WT), prp17Δ, prp17Δtub1Δi, prp22-1, and prp22-1 tub1Δi cells were synchronized in G1 and released to the restrictive temperature. Released cultures were montitored for cell number (upper left) and cell cycle progression as reflected by DNA content.

Similar articles

Cited by

References

    1. Ajuh, P., B. Kuster, K. Panov, J. C. Zomerdijk, M. Mann, and A. I. Lamond. 2000. Functional analysis of the human CDC5L complex and identification of its components by mass spectrometry. EMBO J. 19:6569–6581. - PMC - PubMed
    1. Albright, S. R., and R. Tjian. 2000. TAFs revisited: more data reveal new twists and confirm old ideas. Gene 242:1–13. - PubMed
    1. Apone, L. M., C. M. Virbasius, J. C. Reese, and M. R. Green. 1996. Yeast TAF(II)90 is required for cell-cycle progression through G2/M but not for general transcription activation. Genes Dev. 10:2368–2380. - PubMed
    1. Archer, J. E., L. R. Vega, and F. Solomon. 1995. Rbl2p, a yeast protein that binds to beta-tubulin and participates in microtubule function in vivo. Cell 82:425–434. - PubMed
    1. Ben-Yehuda, S., I. Dix, C. S. Russell, M. McGarvey, J. D. Beggs, and M. Kupiec. 2000. Genetic and physical interactions between factors involved in both cell cycle progression and pre-mRNA splicing in Saccharomyces cerevisiae. Genetics 156:1503–1517. - PMC - PubMed

Publication types

MeSH terms

Substances