Classification of human lung carcinomas by mRNA expression profiling reveals distinct adenocarcinoma subclasses
- PMID: 11707567
- PMCID: PMC61120
- DOI: 10.1073/pnas.191502998
Classification of human lung carcinomas by mRNA expression profiling reveals distinct adenocarcinoma subclasses
Abstract
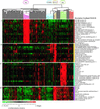
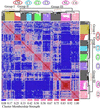
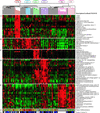
We have generated a molecular taxonomy of lung carcinoma, the leading cause of cancer death in the United States and worldwide. Using oligonucleotide microarrays, we analyzed mRNA expression levels corresponding to 12,600 transcript sequences in 186 lung tumor samples, including 139 adenocarcinomas resected from the lung. Hierarchical and probabilistic clustering of expression data defined distinct subclasses of lung adenocarcinoma. Among these were tumors with high relative expression of neuroendocrine genes and of type II pneumocyte genes, respectively. Retrospective analysis revealed a less favorable outcome for the adenocarcinomas with neuroendocrine gene expression. The diagnostic potential of expression profiling is emphasized by its ability to discriminate primary lung adenocarcinomas from metastases of extra-pulmonary origin. These results suggest that integration of expression profile data with clinical parameters could aid in diagnosis of lung cancer patients.
Figures


Similar articles
-
Diversity of gene expression in adenocarcinoma of the lung.Proc Natl Acad Sci U S A. 2001 Nov 20;98(24):13784-9. doi: 10.1073/pnas.241500798. Epub 2001 Nov 13. Proc Natl Acad Sci U S A. 2001. PMID: 11707590 Free PMC article.
-
Predicting survival within the lung cancer histopathological hierarchy using a multi-scale genomic model of development.PLoS Med. 2006 Jul;3(7):e232. doi: 10.1371/journal.pmed.0030232. PLoS Med. 2006. PMID: 16800721 Free PMC article.
-
Smoking and cancer-related gene expression in bronchial epithelium and non-small-cell lung cancers.J Pathol. 2006 Oct;210(2):192-204. doi: 10.1002/path.2039. J Pathol. 2006. PMID: 16915569
-
Gene expression profiling reveals reproducible human lung adenocarcinoma subtypes in multiple independent patient cohorts.J Clin Oncol. 2006 Nov 1;24(31):5079-90. doi: 10.1200/JCO.2005.05.1748. J Clin Oncol. 2006. PMID: 17075127 Review.
-
[Clinicopathological study on primary lung cancer--immunohistochemical expression of p53 suppressor gene and bcl-2 oncogene in relation to prognosis].Rinsho Byori. 1996 Jan;44(1):32-41. Rinsho Byori. 1996. PMID: 8691638 Review. Japanese.
Cited by
-
PF-06463922 is a potent and selective next-generation ROS1/ALK inhibitor capable of blocking crizotinib-resistant ROS1 mutations.Proc Natl Acad Sci U S A. 2015 Mar 17;112(11):3493-8. doi: 10.1073/pnas.1420785112. Epub 2015 Mar 2. Proc Natl Acad Sci U S A. 2015. PMID: 25733882 Free PMC article.
-
Cross-species functional analysis of cancer-associated fibroblasts identifies a critical role for CLCF1 and IL-6 in non-small cell lung cancer in vivo.Cancer Res. 2012 Nov 15;72(22):5744-56. doi: 10.1158/0008-5472.CAN-12-1097. Epub 2012 Sep 7. Cancer Res. 2012. PMID: 22962265 Free PMC article.
-
ZEB1 drives prometastatic actin cytoskeletal remodeling by downregulating miR-34a expression.J Clin Invest. 2012 Sep;122(9):3170-83. doi: 10.1172/JCI63608. Epub 2012 Aug 1. J Clin Invest. 2012. PMID: 22850877 Free PMC article.
-
Revisiting global gene expression analysis.Cell. 2012 Oct 26;151(3):476-82. doi: 10.1016/j.cell.2012.10.012. Cell. 2012. PMID: 23101621 Free PMC article. Review.
-
A systematic dissection of the epigenomic heterogeneity of lung adenocarcinoma reveals two different subclasses with distinct prognosis and core regulatory networks.Genome Biol. 2021 May 17;22(1):156. doi: 10.1186/s13059-021-02376-1. Genome Biol. 2021. PMID: 34001209 Free PMC article.
References
-
- Greenlee R T, Hill-Harmon M B, Murray T, Thun M. CA Cancer J Clin. 2001;51:15–36. - PubMed
-
- Druker B J, Talpaz M, Resta D J, Peng B, Buchdunger E, Ford J M, Lydon N B, Kantarjian H, Capdeville R, Ohno-Jones S, et al. N Engl J Med. 2001;344:1031–1037. - PubMed
-
- Travis W D, Travis L B, Devesa S S. Cancer. 1995;75:191–202. - PubMed
-
- Sorensen J B, Hirsch F R, Gazdar A, Olsen J E. Cancer. 1993;71:2971–2976. - PubMed
-
- Breathnach O S, Kwiatkowski D J, Finkelstein D M, Godleski J, Sugarbaker D J, Johnson B E, Mentzer S. J Thorac Cardiovasc Surg. 2001;121:42–47. - PubMed
Publication types
MeSH terms
Substances
Grants and funding
LinkOut - more resources
Full Text Sources
Other Literature Sources
Medical
Molecular Biology Databases

