. 2001 Oct 15;194(8):1179-86.
doi: 10.1084/jem.194.8.1179.

Dendritic cell maturation overrules H-2D-mediated natural killer T (NKT) cell inhibition: critical role for B7 in CD1d-dependent NKT cell interferon gamma production

Affiliations

Dendritic cell maturation overrules H-2D-mediated natural killer T (NKT) cell inhibition: critical role for B7 in CD1d-dependent NKT cell interferon gamma production

Y Ikarashi et al. J Exp Med. .

Erratum in

  • J Exp Med 2001 Nov 5;194(9):1391

Abstract

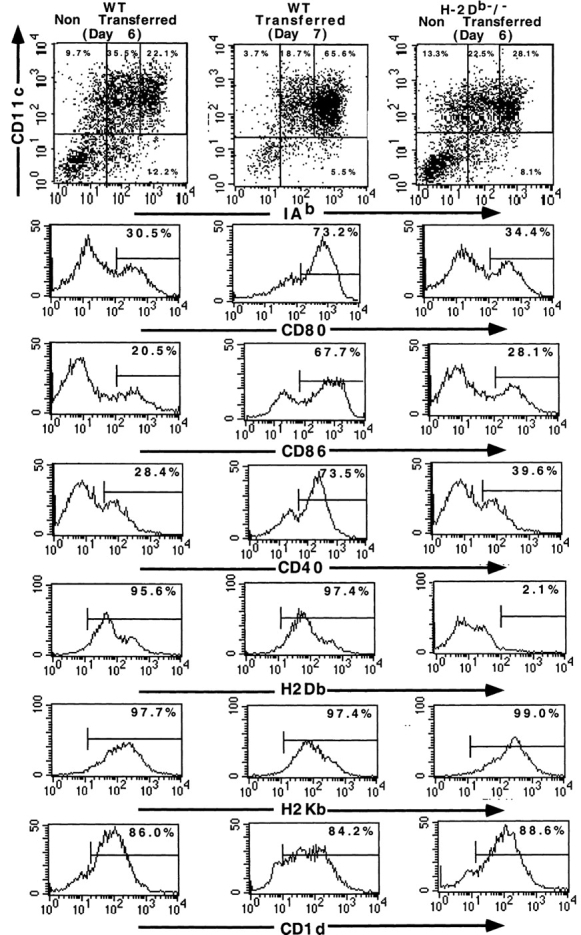
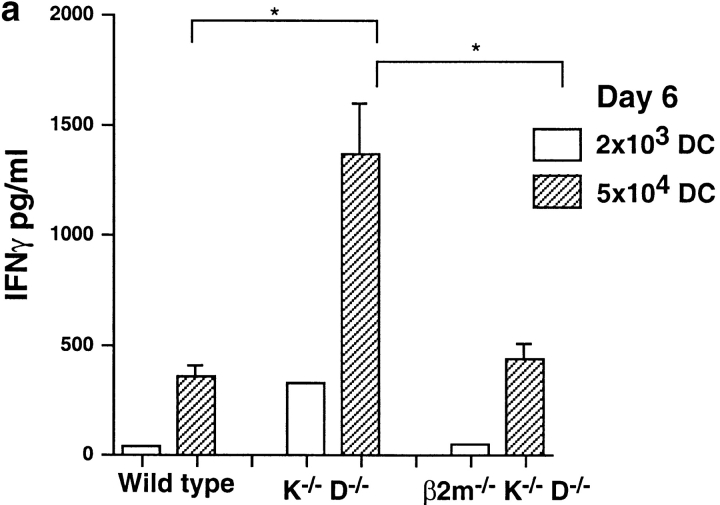
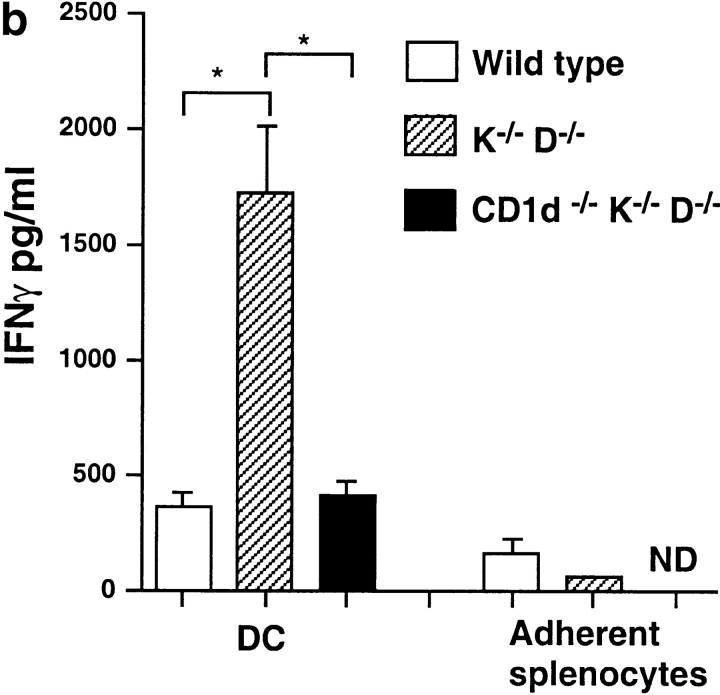
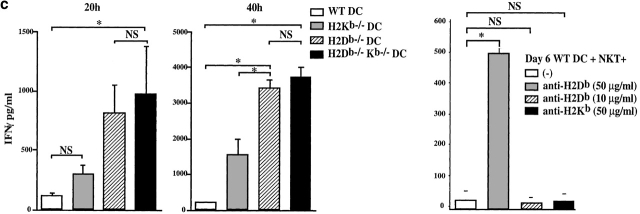
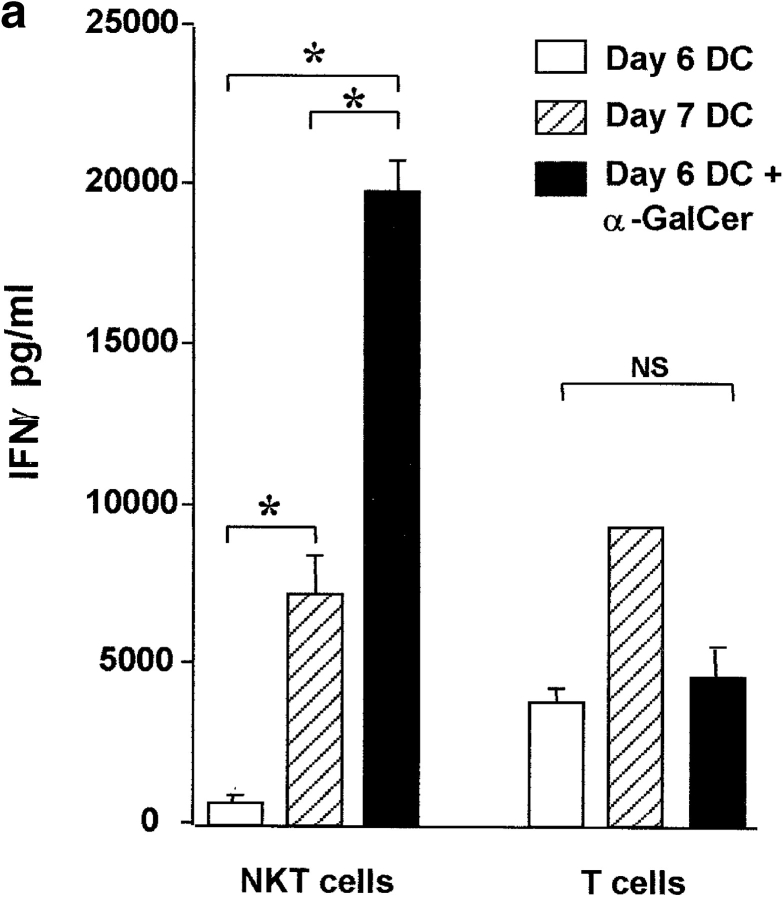
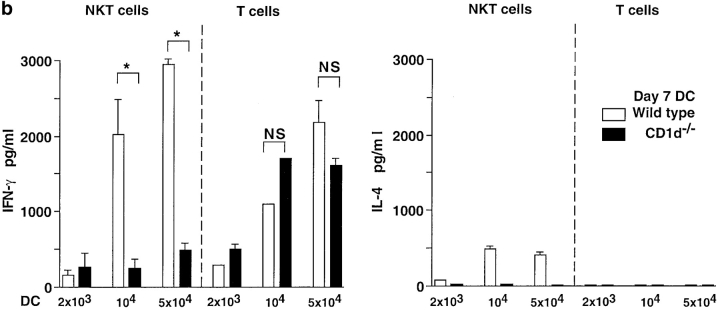
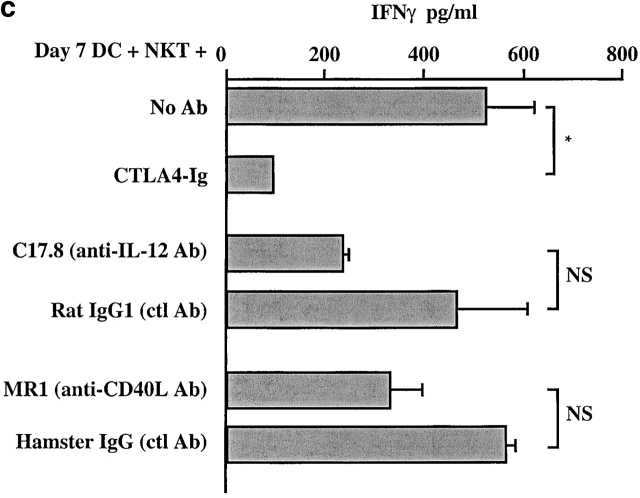
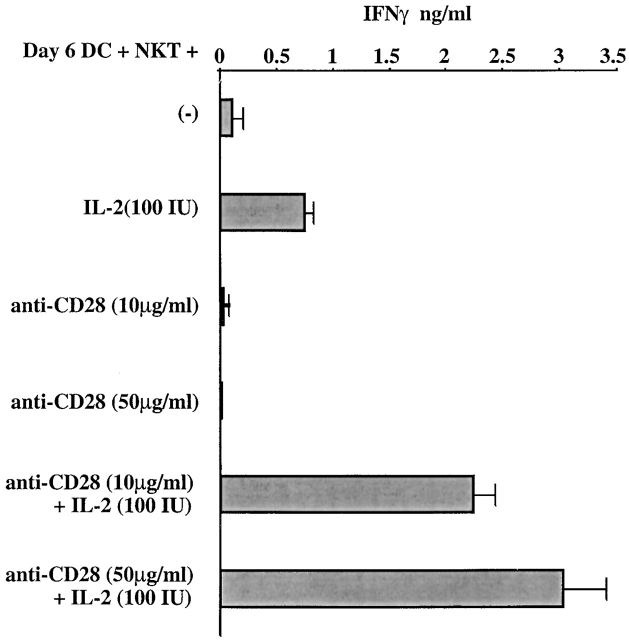
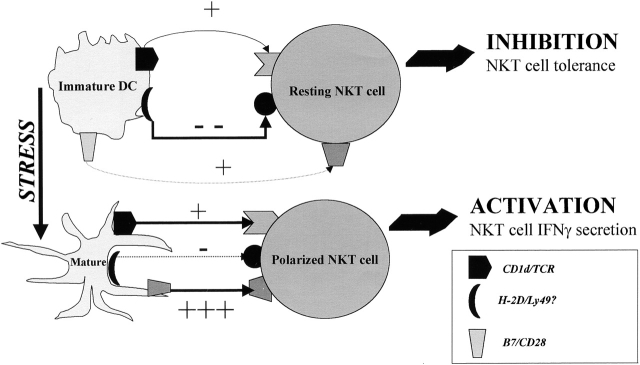
Given the broad expression of H-2 class Ib molecules on hematopoietic cells, antigen presentation pathways among CD1d expressing cells might tightly regulate CD1d-restricted natural killer T (NKT) cells. Bone marrow-derived dendritic cells (BM-DCs) and not adherent splenocytes become capable of triggering NK1.1(+)/T cell receptor (TCR)(int) hepatic NKT cell activation when (a) immature BM-DCs lack H-2D(b)-/- molecules or (b) BM-DCs undergo a stress signal of activation. In such conditions, BM-DCs promote T helper type 1 predominant CD1d-restricted NKT cell stimulation. H-2 class Ia-mediated inhibition involves more the direct H-2D(b) presentation than the indirect Qa-1(b) pathway. Such inhibition can be overruled by B7/CD28 interactions and marginally by CD40/CD40L or interleukin 12. These data point to a unique regulatory role of DCs in NKT cell innate immune responses and suggest that H-2 class Ia and Ib pathways differentially control NKT cell recognition of DC antigens.


Figures

Figure 1
Figure 1
Phenotypic analyses of ex vivo propagated BM-DCs. BM-DCs (GM-CSF plus IL-4) at day 6 (wt, left panels, and H-2Db−/−, right panels) before/or at day 7 after harvesting and transfer into new wells (wt, middle panels) were subjected to two color staining (CD11c-PE and I-Ab-FITC) or one-color staining (CD1d-PE and CD40, CD80, CD86-FITC, indirect staining for H-2Db and H-2Kb expression) and immunostained cells were analyzed in flow cytometry.
Figure 2
Figure 2
Constitutive H-2D–mediated NKT cell inhibition by immature DCs. (a) Day 6 immature BM-DCs derived from B6.wt or H-2Kb/−Db/− double KO or H-2Kb/−Db/−β2m−/−triple KO mice were cocultured at a DC/NKT cell ratio of 1:1 or 1:25 with cell sorted hepatic NK1.1+/TCRint NKT cells for 40 h. (b) Similar experiments were performed comparing BM-DCs with adherent splenocytes derived from B6. wt versus H-2Kb/−Db/− double KO versus CD1d−/− Kb/− Db/− triple KO mice cocultured with NKT cells at a DC/NKT cell ratio of 1:1 for 40 h. (c) Similar experiments were performed comparing immature day 6 BM-DCs derived from single (H-2Kb/− or H-2Db/−) KO mice versus H-2 Kb/−Db/− double KO mice (left panels). 24 and 40 h supernatants were assayed for IFN-γ in ELISA. Right panel depicts IFN-γ levels in the supernatants of NKT cells with day 6 wt BM-DCs incubated with increasing amounts of neutralizing Ab anti–H-2Db or H-2Kb. Means ± SE are depicted in all graphs. Each graph represents either pooled data from three experiments performed in duplicate wells or a representative experiment out of three. Significant differences at 95% confidence using Fisher's exact method are outlined with *. All experiments were performed with KO female mice of 6–8 wk of age after 6–8 backcrosses on C57BL/6 mice. Phenotypic features were comparable in all gene targeted BM-DCs except for H-2 or CD1d molecule expression.
Figure 2
Figure 2
Constitutive H-2D–mediated NKT cell inhibition by immature DCs. (a) Day 6 immature BM-DCs derived from B6.wt or H-2Kb/−Db/− double KO or H-2Kb/−Db/−β2m−/−triple KO mice were cocultured at a DC/NKT cell ratio of 1:1 or 1:25 with cell sorted hepatic NK1.1+/TCRint NKT cells for 40 h. (b) Similar experiments were performed comparing BM-DCs with adherent splenocytes derived from B6. wt versus H-2Kb/−Db/− double KO versus CD1d−/− Kb/− Db/− triple KO mice cocultured with NKT cells at a DC/NKT cell ratio of 1:1 for 40 h. (c) Similar experiments were performed comparing immature day 6 BM-DCs derived from single (H-2Kb/− or H-2Db/−) KO mice versus H-2 Kb/−Db/− double KO mice (left panels). 24 and 40 h supernatants were assayed for IFN-γ in ELISA. Right panel depicts IFN-γ levels in the supernatants of NKT cells with day 6 wt BM-DCs incubated with increasing amounts of neutralizing Ab anti–H-2Db or H-2Kb. Means ± SE are depicted in all graphs. Each graph represents either pooled data from three experiments performed in duplicate wells or a representative experiment out of three. Significant differences at 95% confidence using Fisher's exact method are outlined with *. All experiments were performed with KO female mice of 6–8 wk of age after 6–8 backcrosses on C57BL/6 mice. Phenotypic features were comparable in all gene targeted BM-DCs except for H-2 or CD1d molecule expression.
Figure 3
Figure 3
Stress triggers DC maturation, promoting CD1d-restricted, B7-dependent NKT cell activation. (a) Day 6 immature BM-DCs pulsed or not pulsed with 10 ng/ml of α-GalCer were compared with mature day 7 BM-DCs in a coculture setting with hepatic NKT cells or T cells at a DC/NKT or T cell ratio of 1:5 for 40 h. (b) Cocultures of day 7 transferred DCs derived from B6.wt versus CD1d−/− mice with hepatic NK1.1+ TCR-βint NKT cells or hepatic NK1.1 TCR-βhigh T cells at various DC/NKT ratios were assayed for mIFN-γ (left panels) and at DC/NKT cell ratio of 1:5 for mIL-4 (right panel) using ELISA for 40 h. (c) Day 7 mature DCs were cocultured with NKT cells at a DC/NKT cell ratio of 1:5 for 24 h in the presence of 50 μg/ml of neutralizing mAb directed against mIL-12 (C17.8), mCD40L (MR1), or isotype-matched Ab or CTLA4Ig fusion proteins (left panel). Day 6 wt BM-DC were coincubated with NKT cells at a 1:5 ratio with increasing dosages of the stimulating anti-CD28 Ab PV1 plus or minus 100 IU/ml rhuIL-2 (right panel) for 48 h. Supernatants were assayed for IFN-γ in ELISA. Means ± SE are depicted in all graphs. Each graph depicts one representative experiment out of three performed in duplicate wells. Significant differences at 95% confidence using Fisher's exact method are outlined with *.
Figure 3
Figure 3
Stress triggers DC maturation, promoting CD1d-restricted, B7-dependent NKT cell activation. (a) Day 6 immature BM-DCs pulsed or not pulsed with 10 ng/ml of α-GalCer were compared with mature day 7 BM-DCs in a coculture setting with hepatic NKT cells or T cells at a DC/NKT or T cell ratio of 1:5 for 40 h. (b) Cocultures of day 7 transferred DCs derived from B6.wt versus CD1d−/− mice with hepatic NK1.1+ TCR-βint NKT cells or hepatic NK1.1 TCR-βhigh T cells at various DC/NKT ratios were assayed for mIFN-γ (left panels) and at DC/NKT cell ratio of 1:5 for mIL-4 (right panel) using ELISA for 40 h. (c) Day 7 mature DCs were cocultured with NKT cells at a DC/NKT cell ratio of 1:5 for 24 h in the presence of 50 μg/ml of neutralizing mAb directed against mIL-12 (C17.8), mCD40L (MR1), or isotype-matched Ab or CTLA4Ig fusion proteins (left panel). Day 6 wt BM-DC were coincubated with NKT cells at a 1:5 ratio with increasing dosages of the stimulating anti-CD28 Ab PV1 plus or minus 100 IU/ml rhuIL-2 (right panel) for 48 h. Supernatants were assayed for IFN-γ in ELISA. Means ± SE are depicted in all graphs. Each graph depicts one representative experiment out of three performed in duplicate wells. Significant differences at 95% confidence using Fisher's exact method are outlined with *.
Figure 4
Figure 4
Putative schematic representation of the DC/NKT cell cross-talk. Tissue resident DCs (immature stage) constitutively inhibit CD1d-dependent NKT cell IFN-γ production (first signal: CD1d/TCR) through a mechanism involving H-2 class I molecules (second signal: H-2D/Ly49? +/− CD94/NKG2A ?). The inhibitory pathway might be dominant because a third accessory pathway overruling the dominant negative signal is lacking on immature DCs. In contrast, after stress (LPS, transfer), DCs acquire a third accessory signal (B7/CD28) that is dominant over the second inhibitory pathway allowing CD1d-restricted DC antigen presentation. It is conceivable that in pathological conditions where high IFN-γ levels are required, DCs become capable of triggering NKT cell recognition of self and/or foreign antigens presented by MHC class Ib molecules to the canonical TCR.

Similar articles

Cited by

References

    1. Bendelac A., Riversa M.N., Park S.H., Roark J.H. Mouse CD1-specific NK1+ T cellsdevelopment, specificity, and function. Annu. Rev. Immunol. 1997;15:535–562. - PubMed
    1. MacDonald H.R. NK1.1+ T cell receptor α/β cellsnew clues to their origin, specificity and function. J. Exp. Med. 1995;182:633–638. - PMC - PubMed
    1. Kawano T., Cui J., Koezuka Y., Toura I., Kaneko Y., Motoki K., Ueno H., Nakagawa R., Sato H., Kondo E. CD1d-restricted and TCR-mediated activation of Vα14 NKT cells by glycosylceramides. Science. 1997;278:1626–1629. - PubMed
    1. Spada F.M., Koezuka Y., Porcelli S.A. CD1d-restricted recognition of synthetic glycolipid antigen by human natural killer T cell. J. Exp. Med. 1998;188:1529–1534. - PMC - PubMed
    1. Burdin N., Brossay L., Koezuka Y., Smily S.T., Gurusby M., Gui M., Taniguchi M., Hayakawa K., Kronenberg M. Selective ability of mouse CD1 to present glycolipids. α-galactosylceramide specifically stimulates Vα14 NKT lymphocytes. J. Immunol. 1998;161:3271–3281. - PubMed

Publication types

MeSH terms