Serial analysis of gene expression in Plasmodium falciparum reveals the global expression profile of erythrocytic stages and the presence of anti-sense transcripts in the malarial parasite
- PMID: 11598196
- PMCID: PMC60160
- DOI: 10.1091/mbc.12.10.3114
Serial analysis of gene expression in Plasmodium falciparum reveals the global expression profile of erythrocytic stages and the presence of anti-sense transcripts in the malarial parasite
Abstract
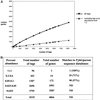
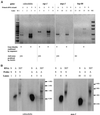
Serial analysis of gene expression (SAGE) was applied to the malarial parasite Plasmodium falciparum to characterize the comprehensive transcriptional profile of erythrocytic stages. A SAGE library of approximately 8335 tags representing 4866 different genes was generated from 3D7 strain parasites. Basic local alignment search tool analysis of high abundance SAGE tags revealed that a majority (88%) corresponded to 3D7 sequence, and despite the low complexity of the genome, 70% of these highly abundant tags matched unique loci. Characterization of these suggested the major metabolic pathways that are used by the organism under normal culture conditions. Furthermore several tags expressed at high abundance (30% of tags matching to unique loci of the 3D7 genome) were derived from previously uncharacterized open reading frames, demonstrating the use of SAGE in genome annotation. The open platform "profiling" nature of SAGE also lead to the important discovery of a novel transcriptional phenomenon in the malarial pathogen: a significant number of highly abundant tags that were derived from annotated genes (17%) corresponded to antisense transcripts. These SAGE data were validated by two independent means, strand specific reverse transcription-polymerase chain reaction and Northern analysis, where antisense messages were detected in both asexual and sexual stages. This finding has implications for transcriptional regulation of Plasmodium gene expression.
Figures


Similar articles
-
Widespread distribution of antisense transcripts in the Plasmodium falciparum genome.Mol Biochem Parasitol. 2004 Jul;136(1):35-42. doi: 10.1016/j.molbiopara.2004.02.007. Mol Biochem Parasitol. 2004. PMID: 15138065
-
Serial analysis of gene expression (SAGE) in Plasmodium falciparum: application of the technique to A-T rich genomes.Mol Biochem Parasitol. 2001 Mar;113(1):23-34. doi: 10.1016/s0166-6851(00)00378-9. Mol Biochem Parasitol. 2001. PMID: 11254951
-
Natural antisense transcripts in Plasmodium falciparum isolates from patients with complicated malaria.Exp Parasitol. 2014 Jun;141:39-54. doi: 10.1016/j.exppara.2014.03.008. Epub 2014 Mar 20. Exp Parasitol. 2014. PMID: 24657575
-
[Transcriptomes for serial analysis of gene expression].J Soc Biol. 2002;196(4):303-7. J Soc Biol. 2002. PMID: 12645300 Review. French.
-
Molecular approaches to monitor parasite genetic complexity in the transmission of Plasmodium falciparum malaria.Parassitologia. 2005 Jun;47(2):199-203. Parassitologia. 2005. PMID: 16252474 Review.
Cited by
-
RNA polymerase II synthesizes antisense RNA in Plasmodium falciparum.RNA. 2005 Apr;11(4):365-70. doi: 10.1261/rna.7940705. Epub 2005 Feb 9. RNA. 2005. PMID: 15703443 Free PMC article.
-
Long Non-Coding RNAs in the Regulation of Gene Expression: Physiology and Disease.Noncoding RNA. 2019 Feb 17;5(1):17. doi: 10.3390/ncrna5010017. Noncoding RNA. 2019. PMID: 30781588 Free PMC article. Review.
-
Role of cis-regulatory elements on the ring-specific hrp3 promoter in the human parasite Plasmodium falciparum.Parasitol Res. 2010 Mar;106(4):833-45. doi: 10.1007/s00436-010-1738-9. Epub 2010 Feb 3. Parasitol Res. 2010. PMID: 20127361
-
PlasmoDB: a functional genomic database for malaria parasites.Nucleic Acids Res. 2009 Jan;37(Database issue):D539-43. doi: 10.1093/nar/gkn814. Epub 2008 Oct 28. Nucleic Acids Res. 2009. PMID: 18957442 Free PMC article.
-
Serial Analysis of Gene Expression in Plasmodium berghei salivary gland sporozoites.BMC Genomics. 2007 Dec 19;8:466. doi: 10.1186/1471-2164-8-466. BMC Genomics. 2007. PMID: 18093287 Free PMC article.
References
-
- Barnwell JW, Galinski MR. Invasion of vertebrate cells: erythrocytes. In: Sherman IW, editor. Malaria: Parasite Biology, Pathogenesis, and Protection. Washington, DC: ASM Press; 1998. pp. 93–120.
-
- Bowman S, Lawson D, Basham D, Brown D, Chillingworth T, Churcher CM, Craig A, Davies RM, Devlin K, Feltwell T, Gentles S, Gwilliam R, Hamlin N, Harris D, Holroyd S, Hornsby T, Horrocks P, Jagels K, Jassal B, Kyes S, McLean J, Moule S, Mungall K, Murphy L, Barrell BG, et al. The complete nucleotide sequence of chromosome 3 of Plasmodium falciparum. Nature. 1999;400:532–538. - PubMed
-
- Butler D. Funding assured for international malaria sequencing project. Nature. 1997;388:701. - PubMed
-
- Chen Q, Fernandez V, Sundstrom A, Schlichtherle M, Datta S, Hagblom P, Wahlgren M. Developmental selection of var gene expression in Plasmodium falciparum. Nature. 1998;394:392–395. - PubMed
Publication types
MeSH terms
Substances
Grants and funding
LinkOut - more resources
Full Text Sources

