. 2001 Aug;12(8):2257-74.
doi: 10.1091/mbc.12.8.2257.

Cdc42-dependent modulation of tight junctions and membrane protein traffic in polarized Madin-Darby canine kidney cells

Affiliations
Free PMC article

Cdc42-dependent modulation of tight junctions and membrane protein traffic in polarized Madin-Darby canine kidney cells

R Rojas et al. Mol Biol Cell. 2001 Aug.
Free PMC article

Abstract

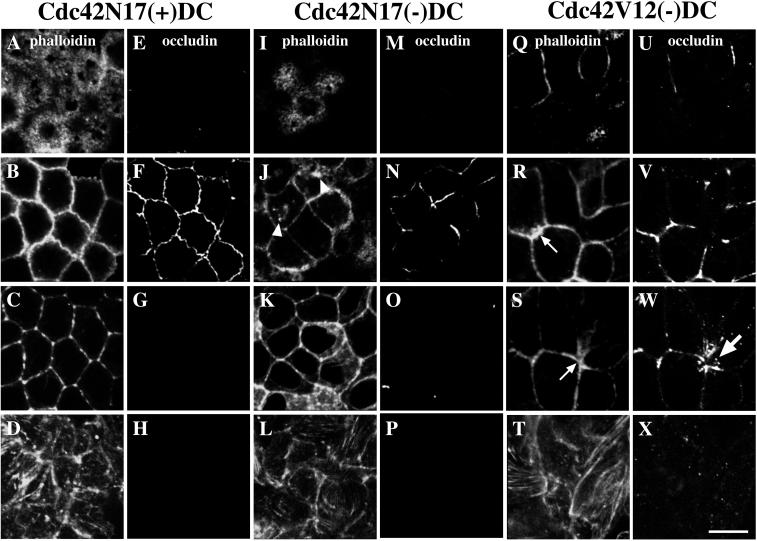
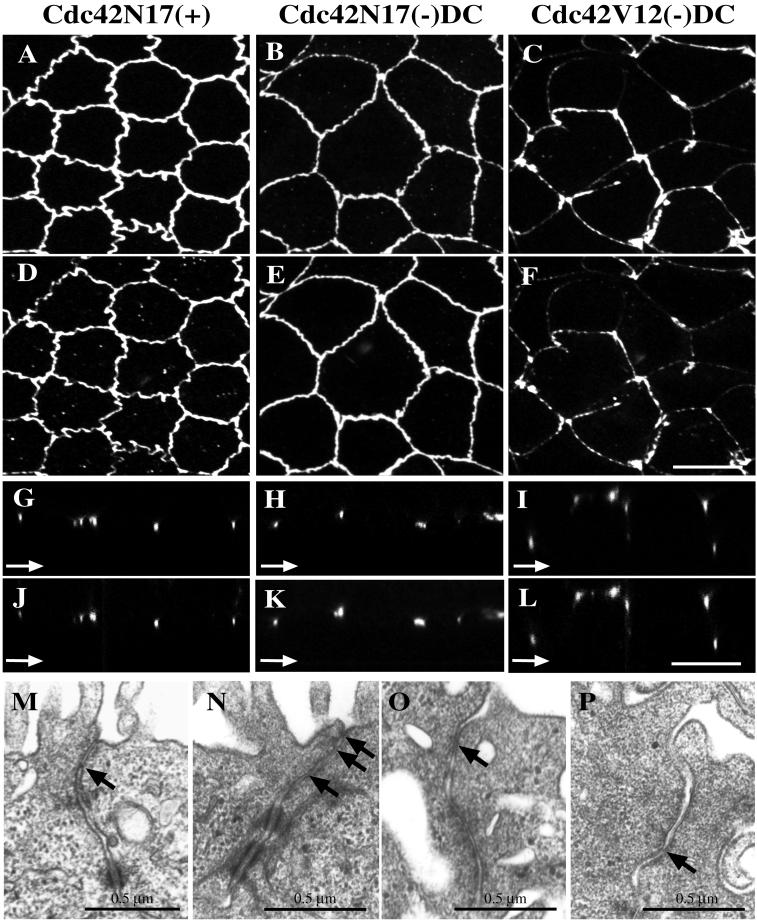
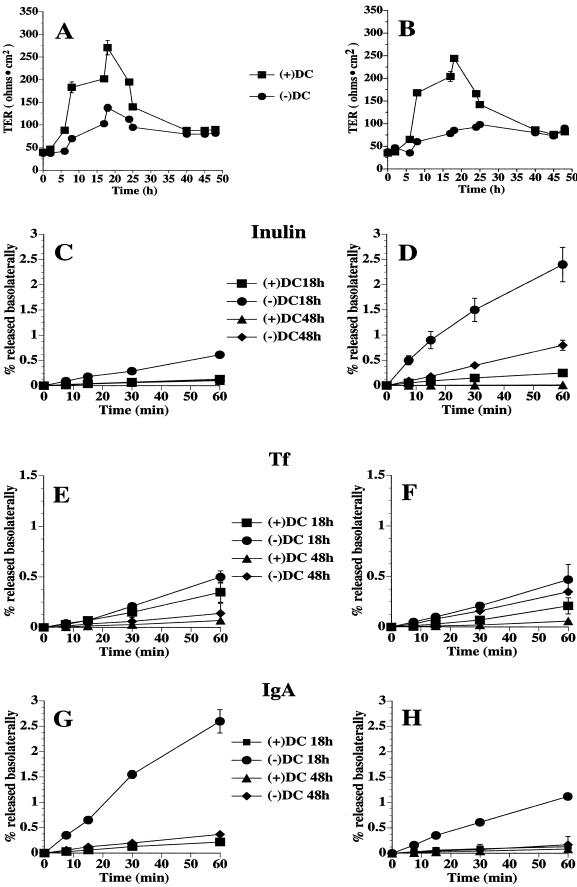
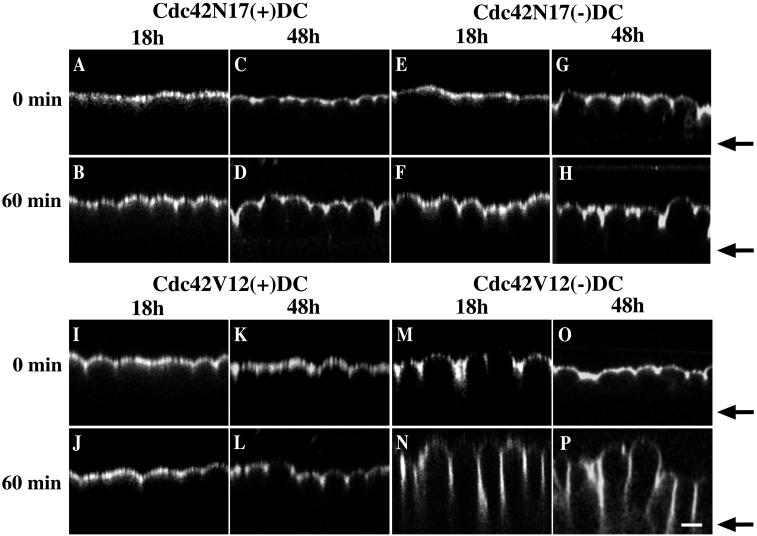
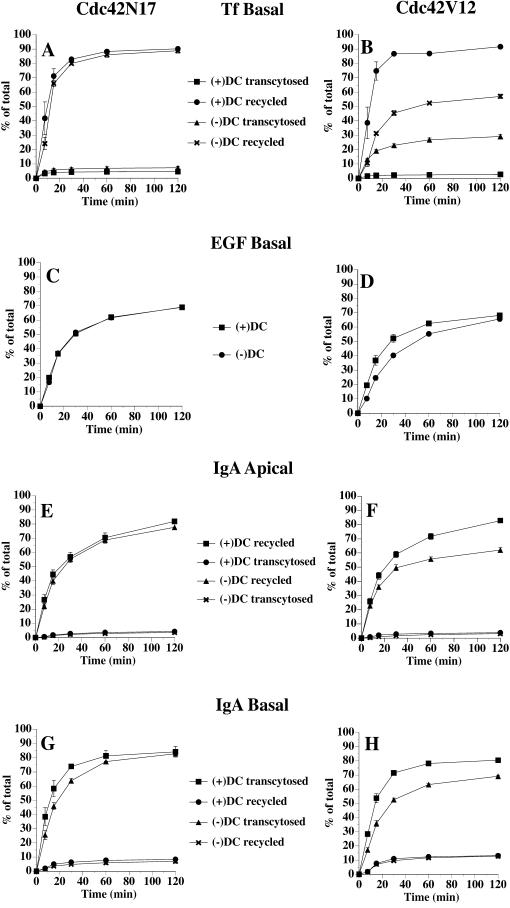
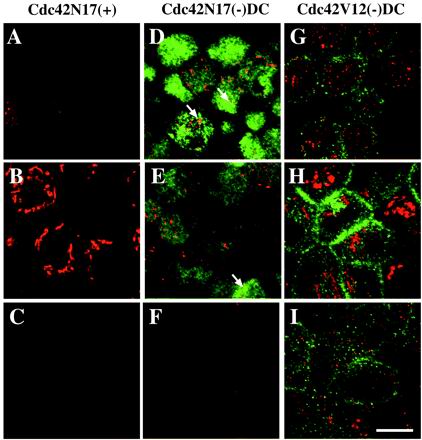
Polarized epithelial cells maintain the asymmetric composition of their apical and basolateral membrane domains by at least two different processes. These include the regulated trafficking of macromolecules from the biosynthetic and endocytic pathway to the appropriate membrane domain and the ability of the tight junction to prevent free mixing of membrane domain-specific proteins and lipids. Cdc42, a Rho family GTPase, is known to govern cellular polarity and membrane traffic in several cell types. We examined whether this protein regulated tight junction function in Madin-Darby canine kidney cells and pathways that direct proteins to the apical and basolateral surface of these cells. We used Madin-Darby canine kidney cells that expressed dominant-active or dominant-negative mutants of Cdc42 under the control of a tetracycline-repressible system. Here we report that expression of dominant-active Cdc42V12 or dominant-negative Cdc42N17 altered tight junction function. Expression of Cdc42V12 slowed endocytic and biosynthetic traffic, and expression of Cdc42N17 slowed apical endocytosis and basolateral to apical transcytosis but stimulated biosynthetic traffic. These results indicate that Cdc42 may modulate multiple cellular pathways required for the maintenance of epithelial cell polarity.


Figures

Figure 1
Figure 1
Inducible expression of myc-tagged Cdc42N17 or Cdc42V12 and their distribution in polarized MDCK cells. Cdc42N17 or Cdc42V12 cells were plated at low density in medium lacking DC (−) or containing DC (+)and then were plated on Transwell filter supports (±DC) for 48 h. (A) The filter-grown cells were solubilized in SDS lysis buffer, the lysates were resolved by SDS-PAGE, and Western blots of the cellular lysates were probed with an anti-Cdc42 polyclonal antibody to detect induction of the myc-tagged Cdc42 mutant proteins as well as endogenous Cdc42. Endogenous Cdc42 is marked with an arrow. The addition of the myc tag to Cdc42N17 and Cdc42V12 causes these proteins to migrate more slowly than endogenous Cdc42 on SDS-PAGE. Similar levels of protein expression were observed 18 h postplating on Transwells. Cdc42N17 (B–E) and Cdc42V12 (F–I) cells were fixed with the use of a pH-shift protocol, incubated with a myc tag-specific antibody, and then a goat anti-mouse secondary antibody conjugated to FITC. Images were captured with the use of a scanning-laser confocal microscope. Shown are optical sections taken at the apical pole of the cells (B and F), 2 μm below the previous section (C and G), around the level of the nucleus (D and H), or at the base of the cells (E and I). Central aggregates are marked with arrows. Bar, 10 μm.
Figure 2
Figure 2
Distribution of occludin and F-actin in Cdc42N17 cells grown in the presence of DC (A–H), Cdc42N17 cells grown in the absence of DC (I–P), or Cdc42V12 cells grown in the absence of DC (Q-X). The distribution of FITC-phalloidin and occludin in Cdc42V12 cells grown in the presence of DC was similar to A–H and is not shown. Cells were cultured on Transwells for 48 h, fixed with the use of a pH-shift protocol, incubated with rabbit anti-occludin antibody, and then reacted with goat anti-rabbit Cy5 and FITC-phalloidin. The FITC and Cy5 emissions were captured simultaneously with the use of a scanning-laser confocal microscope. Staining for FITC-phalloidin is shown in A–D, I–L, and Q–T. Staining for occludin is shown in E–H, M–P, and U–X. Single optical sections are shown from the base of the cells below the nucleus (D, H, L, P, T, and X), from the lateral surface of the cell at the level of the nucleus (C, G, K, O, S, and W), from the apical region of the cell above the nucleus (B, F, J, N, R, and V), and from the apical pole of the cell at or above the level of the tight junctional complex (A, E, I, M, Q, and U). Arrowheads in J point to accumulations of actin in the apical cytoplasm. Small arrows in R and S point to thickening of actin at the sites of cell-cell contact. The large arrow in W shows a region of cell-cell contact where the distribution of occludin is altered. Bar, 10 μm
Figure 3
Figure 3
Ultrastructural analysis of tight junctions and distribution of the tight junction-associated proteins occludin and ZO-1 in cells expressing Cdc42N17 or Cdc42V12. (A–L) Shown are Cdc42N17 cells cultured in the presence of DC (A, D, G, and J), Cdc42N17 cells grown in the absence of DC (B, E, H, and K), and Cdc42V12 cells cultured in the absence of DC (C, F, I, and L). The distribution of occludin and ZO-1 in Cdc42V12 cells grown in the presence of DC was identical to A, D, G, and J and is not shown. Cells were fixed with the use of a pH-shift protocol, incubated with antibodies against occludin (A–C and G–I) and ZO-1 (D-F and J–L), and then reacted with goat anti-rabbit secondary antibody conjugated to FITC and goat anti-rat secondary antibody conjugated to Cy5. Images were captured simultaneously with the use of a scanning-laser confocal microscope. Projections of the total image volume are shown in A–F. X–Z sections are shown in G–L. The position of the filter is marked with an arrow in G–L. Bar, 10 μm. (M–P) Transmission electron micrographs of Cdc42N17 cells grown in the presence (M) or absence of DC (N) or Cdc42V12 cells grown in the absence of DC (O–P). The tight junctions of Cdc42V12 cells grown in the presence of DC looked similar to those shown in M and are not shown. Arrows point to regions of the junctional complex where the membranes appear to be fused.
Figure 4
Figure 4
Development of TER and measurement of [14C]inulin, 125I-Tf, and 125I-IgA flux in Cdc42N17 or Cdc42V12 cell lines. (A and B) Cdc42N17 (A) or Cdc42V12 (B) cells were plated on Transwells in low calcium medium (±DC), and cell-cell contact was synchronously induced by switching to normal calcium medium (±DC). TER (Ωcm2) was measured at the designated time points after induction of cell-cell contact. The data are reported as the means ± SEM; n = 18. In some cases the error is smaller than the symbol. (C–H) Cdc42N17 (C, E, and G) or Cdc42V12 (D, F, and H) cells were cultured on Transwells in the presence (+) or absence (−) of DC for 18 or 48 h. [14C]inulin (C and D), 125I-Tf (E and F), or 125I-IgA(G and H) was added to the apical chamber of the Transwell unit and the percentage of initially added marker that diffused into the basal chamber was quantified over time. Shown are data (means ± SEM; n = 3) from a representative experiment. In some cases the error is smaller than the symbol. In G the data from Cdc42N17 cells grown in the absence of DC for 48 h overlaps completely the data from cells grown in the presence of DC for 18 h.
Figure 5
Figure 5
Lateral diffusion of BODIPY-sphingomyelin from the apical to basolateral membrane of cells expressing Cdc42N17 or Cdc42V12. Cdc42N17 (A–H) or Cdc42V12 (I–P) cells were cultured on Transwells in the presence (A–D and I–L) or absence (E–H and M-P) of DC for 18 h (A and B, E and F, I and J, and M and N) or 48 h (C and D, G and H, K and L, and O and P). The apical cell surface was labeled with BODIPY-sphingomyelin on ice for 10 min. The cells were washed and then were either immediately examined by confocal microscopy (A, C, E, G, I, K, M, and O) or incubated for an additional 60 min (B, D, F, H, J, L, N, and P) on ice before examination. X–Z projections from a representative experiment are shown. The position of the filter is marked with arrows. Bar, 10 μm
Figure 6
Figure 6
Apical and basolateral endocytosis of IgA in Cdc42N17 or Cdc42V12 cells. Cdc42N17 (A and C) or Cdc42V12 (B and D) cells were cultured on Transwells in the presence (+) or absence (−) of DC for 48 h. 125I-IgA was bound to the basolateral (A and B) or apical (C and D) surface of the cells for 60 min at 4°C. The cells were washed and then incubated at 37°C for the times indicated. The media were collected and the cells were then rapidly cooled on ice. 125I-IgA was stripped from the cell surface by a sequential treatment with trypsin and acid at 4°C and the filters were cut out of their holders. Total 125I-IgA initially bound to the cells included ligand released into the medium, ligand stripped from the cell surface with trypsin and acid, and cell-associated ligand protected from stripping (endocytosed) and was quantified in a gamma counter. Data are from three separate experiments (means ± SEM; n ≥ 8). *Values were significantly different from control (p < 0.05).
Figure 7
Figure 7
Postendocytic fate of internalized Tf, EGF, or IgA in cells expressing Cdc42N17 or Cdc42V12. Cdc42N17 (A, C, E, and G) or Cdc42V12 (B, D, F, and H) cells were cultured on Transwells in the presence (+) or absence (−) of DC for 48 h. (A and B) 125I-Tf was internalized from the basolateral surface of the cells for 45 min at 37°C, and the cells were washed and then chased for 120 min. The percentage of total ligand released apically (transcytosed) or basolaterally (recycled) is shown. (C and D) 125I-EGF was internalized from the basolateral surface of the cells for 10 min at 37°C, and the cells were washed and then chased for 120 min at 37°C. The percentage of total ligand degraded is shown. (E and F) 125I-IgA was internalized from the apical surface of the cells for 10 min at 37°C, and the cells were washed and then chased for 120 min. The percentage of total ligand released apically (recycled) or basolaterally (transcytosed) is shown. (G and H) 125I-IgA was internalized from the basolateral surface of the cells for 10 min at 37°C, and the cells were washed and then chased for 120 min. The percentage of total ligand released apically (transcytosed) or basolaterally (recycled) is shown. In A–H, experiments were repeated four times in triplicate. Values are averages of the means from each of the four trials ± SEM
Figure 8
Figure 8
Distribution of the Golgi-associated protein giantin in cells expressing Cdc42N17 or Cdc42V12. Shown are Cdc42N17 cells cultured in the presence of DC (A–C), Cdc42N17 cells grown in the absence of DC (D-F), and Cdc42V12 cells cultured in the absence of DC (G–I). The distribution of giantin in Cdc42V12 cells grown in the presence of DC was identical to A–C and is not shown. Cells were fixed with the use of a pH-shift protocol, incubated with giantin and myc tag-specific antibodies, and then incubated with appropriate secondary antibodies conjugated to FITC or Cy5. Images were captured with the use of a scanning-laser confocal microscope and the FITC and Cy5 signals were merged. The staining for giantin appears red and that of the myc tag-labeled Cdc42V12 or Cdc42N17 appears green in this figure. Shown are single optical sections from the apical pole of the cell (A, D, and G), at the level of the nucleus (B, E, and H), or along the lateral surfaces of the cell (C, F, and I). Representative regions of colocalization are marked with arrows. Bar, 10 μm.
Figure 9
Figure 9
Biosynthetic transport in cells expressing mutants of Cdc42. (A) Cdc42N17 or Cdc42V12 cells were grown in the presence (+) or absence (−) of DC on Transwell filters for 48 h. Cells were metabolically labeled with [35S]cysteine for 15 min at 37°C and then chased in the presence or absence of basolateral trypsin for 60 min at 37°C as described previously (Apodaca et al., 1993; Aroeti and Mostov, 1994). In the presence of trypsin newly synthesized pIgR that is delivered to the basolateral cell surface is rapidly proteolyzed. By comparing the amount of immunoprecipitable pIgR in non trypsin-treated cells and those treated with trypsin it is possible to quantify the extent of pIgR delivery to the basolateral or apical cell surface. The percentage of apical and basolateral delivery is shown (mean ± SEM; n ≥ 5). Cdc42N17 (B) or Cdc42V12 (C) cells were grown in the presence (+) or absence (−) of DC on Transwell filters for 48 h. Cells were metabolically labeled for 15 min with [35S]methionine/cysteine and then chased for 15–60 min at 37°C. An aliquot of the apical or basolateral medium was separated by SDS-PAGE and the amount of apical or basolateral gp80 secretion was quantified with the use of a PhosphorImager. Values are means ± SEM, n ≥ 3.

Similar articles

Cited by

References

    1. Adams AEM, Johnson DI, Longnecker RM, Sloat BF, Pringle JR. CDC42 and CDC43, two additional genes involved in budding and the establishment of cell polarity in the yeast Saccharomyces cerevisiae. J Cell Biol. 1990;111:131–142. - PMC - PubMed
    1. Apodaca G. Endocytic traffic in polarized epithelial cells: role of the actin and microtubule cytoskeleton. Traffic. 2001;2:149–159. - PubMed
    1. Apodaca G, Aroeti B, Tang K, Mostov KE. Brefeldin-A inhibits the delivery of the polymeric immunoglobulin receptor to the basolateral surface of MDCK cells. J Biol Chem. 1993;268:20380–20385. - PubMed
    1. Apodaca G, Bomsel M, Lindstedt R, Engel J, Frank D, Mostov KE, Wiener-Kronish J. Characterization of Pseudomonas aeruginosa-induced MDCK cell injury: glycosylation defective host cells are resistant to bacterial killing. Infect Immun. 1995;63:1541–1551. - PMC - PubMed
    1. Apodaca G, Katz LA, Mostov KE. Receptor-mediated transcytosis of IgA in MDCK cells is via apical recycling endosomes. J Cell Biol. 1994;125:67–86. - PMC - PubMed

Publication types

MeSH terms

LinkOut - more resources