. 2001 Aug 20;154(4):775-84.
doi: 10.1083/jcb.200101113.

Comparisons of CapG and gelsolin-null macrophages: demonstration of a unique role for CapG in receptor-mediated ruffling, phagocytosis, and vesicle rocketing

Affiliations

Comparisons of CapG and gelsolin-null macrophages: demonstration of a unique role for CapG in receptor-mediated ruffling, phagocytosis, and vesicle rocketing

W Witke et al. J Cell Biol. .

Abstract

Capping the barbed ends of actin filaments is a critical step for regulating actin-based motility in nonmuscle cells. The in vivo function of CapG, a calcium-sensitive barbed end capping protein and member of the gelsolin/villin family, has been assessed using a null Capg allele engineered into mice. Both CapG-null mice and CapG/gelsolin double-null mice appear normal and have no gross functional abnormalities. However, the loss of CapG in bone marrow macrophages profoundly inhibits macrophage colony stimulating factor-stimulated ruffling; reintroduction of CapG protein by microinjection fully restores this function. CapG-null macrophages also demonstrate approximately 50% impairment of immunoglobulin G, and complement-opsonized phagocytosis and lanthanum-induced vesicle rocketing. These motile functions are not impaired in gelsolin-null macrophages and no additive effects are observed in CapG/gelsolin double-null macrophages, establishing that CapG function is distinct from, and does not overlap with, gelsolin in macrophages. Our observations indicate that CapG is required for receptor-mediated ruffling, and that it is a major functional component of macrophage phagocytosis. These primary effects on macrophage motile function suggest that CapG may be a useful target for the regulation of macrophage-mediated inflammatory responses.


Figures
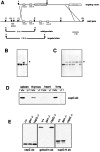
Figure 1.
Figure 1.
Generation of Capg −/− mice. (A) Diagram of the murine Capg gene and the gene-targeting construct. The probe used for Southern blot analysis and expected fragment sizes are indicated. (B and C) Southern blot analysis of BamHI-digested ES cell DNAs. The shifted 6.8-kb band (*) indicates that homologous recombination has occurred. (D) Southern blot analysis of DNAs derived from an intercross of mice each having a targeted Capg allele. One mouse is homozygous for the targeted allele. Immunoblot analysis of tissue extracts from wild-type and CapG-null mice using a rabbit IgG anti-CapG polyclonal antibody (ab). No CapG was detected in any tissue from the CapG-null mice. (E) Immunoblot analysis of macrophage extracts from wild-type, gelsolin-null, and CapG-null mice using antibodies against CapZ, gelsolin, and the NH2 terminus of CapG. There is no significant difference in the concentrations of CapZ and gelsolin between wild-type and CapG-null cells, and no CapG signal of any size.
Figure 2.
Figure 2.
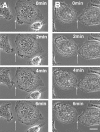
Spontaneous ruffling response of (A) wild-type and (B) CapG-null mouse bone marrow macrophages demonstrated by time-lapse phase microscopy. Images were obtained at 10-s intervals. Note the marked changes in the peripheral membrane of wild-type cells (see arrow) compared with CapG-null macrophages.
Figure 3.
Figure 3.
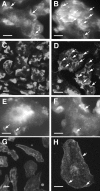
Effects of MCSF on the ruffling response of wild-type and Capg −/− macrophages. Phalloidin staining of wild-type (A–D) and CapG-null (E–H) macrophages before and after exposure to MCSF. Cells were fixed and stained with rhodamine-phalloidin either before or 5 min after exposure to MCSF. Images C, D, G, and H are confocal images; C and G are representative lower power views. Note the increase in serpentine staining indicative of ruffling (arrows) in cells exposed to MCSF compared with unstimulated cells in wild-type, but not in Capg −/− cells. Bars, 10 mm.
Figure 4.
Figure 4.
Quantitation of the ruffling responses of wild-type and Capg −/− macrophages. (A) Bar graphs comparing the ruffling indexes of wild-type and Capg −/− macrophages before and after exposure to MCSF. The ruffling index was determined based on analysis of phalloidin staining by a blinded observer (Materials and methods). In the first four bars, brackets represent the SEM for 80–100 determinations/condition. Wild-type cells have a higher spontaneous ruffling index and nearly double their ruffling activity in response to MCSF, whereas Capg −/− macrophages have a lower spontaneous ruffling activity and fail to respond to MCSF. The far right bar quantifies the ruffling activity of Capg −/− cells stimulated with MCSF after introduction of recombinant CapG by microinjection. Bracket represents the SEM of n = 34 cells. CSF, MCSF. (B) Bar graphs comparing the ruffling responses of wild-type and Capg −/− macrophages after exposure to Salmonella (Salm.). Unlike MCSF which failed to stimulate ruffling in Capg −/− macrophages, exposure to Salmonella resulted in a significant increase in ruffling activity (P < 0.0001). Brackets represent the SEM of n = 80–100 measurements. Cells were scored as described in A. (C and D) Phase micrographs of wild-type (C) and Capg /− (D) macrophages after 30-min exposure to Salmonella. Note the giant phagolysosomes in both the wild-type and Capg −/− cells induced by exposure to the bacteria. Arrows point to individual bacteria contained in giant phagolysosomes. Bar, 10 mm.
Figure 4.
Figure 4.
Quantitation of the ruffling responses of wild-type and Capg −/− macrophages. (A) Bar graphs comparing the ruffling indexes of wild-type and Capg −/− macrophages before and after exposure to MCSF. The ruffling index was determined based on analysis of phalloidin staining by a blinded observer (Materials and methods). In the first four bars, brackets represent the SEM for 80–100 determinations/condition. Wild-type cells have a higher spontaneous ruffling index and nearly double their ruffling activity in response to MCSF, whereas Capg −/− macrophages have a lower spontaneous ruffling activity and fail to respond to MCSF. The far right bar quantifies the ruffling activity of Capg −/− cells stimulated with MCSF after introduction of recombinant CapG by microinjection. Bracket represents the SEM of n = 34 cells. CSF, MCSF. (B) Bar graphs comparing the ruffling responses of wild-type and Capg −/− macrophages after exposure to Salmonella (Salm.). Unlike MCSF which failed to stimulate ruffling in Capg −/− macrophages, exposure to Salmonella resulted in a significant increase in ruffling activity (P < 0.0001). Brackets represent the SEM of n = 80–100 measurements. Cells were scored as described in A. (C and D) Phase micrographs of wild-type (C) and Capg /− (D) macrophages after 30-min exposure to Salmonella. Note the giant phagolysosomes in both the wild-type and Capg −/− cells induced by exposure to the bacteria. Arrows point to individual bacteria contained in giant phagolysosomes. Bar, 10 mm.
Figure 5.
Figure 5.
Phagocytic rates of wild-type and Capg −/− macrophages. (A) Line graph quantitating the number of IgG-opsonized zymosan particles ingested over time. Macrophages were exposed to the opsonized zymosan particles and at the times depicted were cooled to 4°C. Cells were overlaid with Trypan blue to quench extracellular particles and the number of particles inside each cell were counted. Brackets represent the SEM of 90–100 cells counted per time point. The slope of the Capg −/− cells was half that of wild-type cells. (B) Line graph quantitating the number of complement-opsonized zymosan particles ingested over time. Brackets represent the SEM of 100 cells per time point. The slope was reduced by approximately 35% in the Capg −/− cells. Wild-type cells failed to ingest additional particles at 22.5 min (mean particles/cell 8.8 ± 0.3; n =100) Therefore, meaningful comparisons between wild-type and Capg −/− cells could not be made at this time point. (C) Line graph quantitating the number of unopsonized zymosan particles ingested over time. No significant ingestion was observed at 7.5 min. Brackets represent the SEM of 100 cells/time point.
Figure 6.
Figure 6.
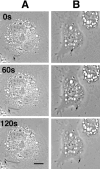
Time-lapse phase micrographs of endosomal rocketing in wild-type and Capg −/− macrophages. Cells were treated with lanthanum and zinc chloride as described in the Materials and methods. This treatment induces the formation of vesicles that move through the cytoplasm by an actin-based motor. (A) The left-hand column shows a vesicle rocketing through a wild-type macrophage (arrow). (B) The right-hand column shows a vesicle migrating through a Capg −/− macrophage (arrow). Time is depicted in the upper left-hand corner. Note the long phase-dense actin tail in the wild-type cell (A) and the very short actin tail in the Capg−/− cell (B). Phase-dense tails were rarely seen behind rocketing vesicles in Capg −/−, but were commonly seen in wild-type cells. The average velocity of rocketing vesicles in Capg −/− macrophages was <1/2 that of wild-type cells. Bar, 10 mm.
Figure 7.
Figure 7.
Cytosolic [Ca2+] changes in wild-type and Capg −/− macrophages after stimulation with PAF. Adherent macrophages were loaded with Fura-2 as described in the Materials and methods, and fluorescence was monitored over time. Intracellular Ca2+ was calibrated as described in the Materials and methods. Arrows depict the time point when a final concentration of 20 ng/ml of PAF was added to the buffer. This experiment is representative of 7 determinations in wild-type and 10 determinations in Capg −/− macrophages. The peak [Ca2+]I was 800 nM in wild-type and 750 nM in Capg −/− cells.
Figure 8.
Figure 8.
Comparisons of wild-type, Gsn −/− , Capg −/− , and Gsn −/− / Capg −/− bone marrow macrophages. Removal of gelsolin failed to significantly impair any of the motile functions tested. (A) Bar graphs comparing the ruffling indexes of all four types of macrophages before and after exposure to MCSF. Brackets represent the SEM of n = 90–100 cells for each group. (B) Line graphs comparing the phagocytic rate for IgG-opsonized zymosan ingestion in the four cell types. Brackets represent the SEM of n = 90–100. (C) Bar graphs comparing the vesicle rocket velocities in the four cell types. Brackets represent the SEM of n = 90–100. C, Capg; G, Gsn.

Similar articles

Cited by

References

    1. Alpuche-Aranda, C.M., E.L. Racoosin, J.A. Swanson, and S.I. Miller. 1994. Salmonella stimulate macrophage macropinocytosis and persist within spacious phagosomes. J. Exp. Med. 179:601–608. - PMC - PubMed
    1. Amatruda, J.F., J.F. Cannon, K. Tatchell, C. Hug, and J.A. Cooper. 1990. Disruption of the actin cytoskeleton in yeast capping protein mutants. Nature. 344:352–354. - PubMed
    1. Arnaudeau, S., W.L. Kelley, J.V. Walsh, Jr., and N. Demaurex. 2001. Mitochondria recycle calcium to the endoplasmic reticulum and prevent the depletion of neighboring ER regions. J. Biol. Chem. 276:29430–29439. - PubMed
    1. Azuma, T., W. Witke, T.P. Stossel, J.H. Hartwig, and D.J. Kwiatkowski. 1998. Gelsolin is a downstream effector of rac for fibroblast motility. EMBO J. 17:1362–1370. - PMC - PubMed
    1. Barkalow, K., W. Witke, D.J. Kwiatkowski, and J.H. Hartwig. 1996. Coordinated regulation of platelet actin filament barbed ends by gelsolin and capping protein. J. Cell Biol. 134:389–399. - PMC - PubMed

Publication types