. 2001 Sep;75(18):8368-79.
doi: 10.1128/jvi.75.18.8368-8379.2001.

Kinetic analysis of the steps of the polyomavirus lytic cycle

Affiliations

Kinetic analysis of the steps of the polyomavirus lytic cycle

L Chen et al. J Virol. 2001 Sep.

Abstract

Kinetic studies of the accumulation of early and late transcripts, early and late proteins, genomes, and live virus, during the lytic cycle of murine polyomavirus wild-type A2, were carried out in synchronized NIH 3T3 cells released from G(0) by the addition of serum after infection. This first-time simultaneous analysis of all parameters of the virus life cycle led to new insights concerning the transcriptional control at the early-to-late transition. During the early phase, early transcripts were synthesized at very low levels, detectable only by reverse transcription-PCR, from 6 h postinfection (hpi). Large T protein could be detected by 8 hpi (while infected cells were in the G(1) phase). The level of expression of the middle T and small T proteins was lower than that of large T at all times, due, at least in part, to a splicing preference for the large-T 5' splice site at nucleotide 411. A large increase in the level of both early and late transcripts coincided closely with the detection in mid-S phase of viral genome amplification. Thereafter, both classes of transcripts continued to further accumulate up to the end of the experiments (48 hpi). In addition, during the late phase, "giant" multigenomic transcripts were synthesized from the early as well as the late promoter. Thus, a major type of transcriptional control appears to be applied similarly to the transcription of both early and late genes. This view differs from that in the literature, which highlights the enhancement of late transcription and the repression of early transcription. However, despite this parallel transcriptional control, additional regulations are applied which result in higher levels of late compared to early transcripts, as previously described. In the accompanying article, a key role for middle T and/or small T in this late-phase enhancement of early and late transcription is demonstrated (16). Other novel findings, e.g., the synthesis of a very abundant short early promoter proximal RNA, are also described.


Figures

FIG. 1
FIG. 1
Northern analysis of the viral transcripts. Cells were infected as described in Materials and Methods. Total RNA was extracted at the times shown (HPI = hpi), electrophoresed, and transferred onto a membrane. The blot was hybridized to a 32P-labeled probe for the cellular GAPDH gene (shown at the bottom), stripped, and rehybridized with a genomic 32P-labeled polyomavirus DNA probe. The positions of the 28S and 18S RNAs derived from the ethidium bromide staining are shown, as well as that of the remnant of the GAPDH signal. The phase of cell cycle of the largest fraction of the cell population at the time of sampling was defined by FACS analysis and is shown at the top. The time scale is not linear.
FIG. 2
FIG. 2
RT-PCR analysis of the early viral transcripts. (A) The positions of the two primers with respect to the early-region introns are shown. The positions of the two 5′ (nt 411 and 748) and the two 3′ (nt 797 and 811) splice sites are shown on the bottom line. The size of the four resulting RT-PCR products for the large T (LT), middle T (MT), small T (ST), and unspliced transcripts are shown on the right. (B) RNA isolated at the times shown (HPI = hpi) and purified as described in Materials and Methods was subjected to one round of RT and various cycles of PCR amplification, using primers P1 and P2. A control for each transcript using viral DNA (M1), small T cDNA (M2), middle T cDNA (M3), and large T cDNA (M4) was carried out in the same reaction. The experimental and control products were separated by gel electrophoresis, transferred to a membrane, hybridized, and exposed to X-ray films. A darker exposure of the film region corresponding to the large T product is shown. The counts in the bands were determined by scanning the membrane with a PhosphorImager. The ratio of the counts in the large T band to those the middle T-small T band are shown. The ratio in the relative level of transcripts is corrected for the difference in size.
FIG. 3
FIG. 3
Analysis of the early viral proteins. Cells were infected as described in the legend to Fig. 1. Proteins were extracted at the times shown (HPI = hpi). The first lane represents an uninfected control. (A) The Western blot was probed with a polyclonal antitumor serum. The three early polyomavirus proteins are identified on the right as large (LT), middle (MT), and small (ST) T antigens. The phase of the cell cycle, for the majority of the infected cells, at the time of harvest is shown on the top. (B) The blot shown in panel A was stripped and probed with a monoclonal antiserum (PN116) directed against the amino terminus common to the three viral proteins.
FIG. 4
FIG. 4
Middle-T-associated kinase activity. Cells were infected as described in the legend to Fig. 1 and extracted at the times shown. (A) Kinase assay. A total of 2 × 10⁶ cells were immunoprecipitated with the polyclonal serum at the times shown, and a kinase assay was performed as described in Materials and Methods. Controls with preimmune serum were carried out at the 24- and 36-hpi time points. An uninfected cell control precipitated with immune serum was carried out at 24 hpi. The band representing middle T phosphorylated in tyrosine residue(s) is marked with a star. (B) A Western blot of extracts of the same infected cells (105 cells). This blot was probed with a polyclonal serum. The three early polyomavirus proteins are identified on the right: large (LT), middle (MT), and small (ST) T. This antiserum detects a cellular protein (identified with an arrow), which serves as a loading control. HPI = hpi.
FIG. 5
FIG. 5
Southern blot analysis of the amplification of the viral genomes. Cells were infected as described in the legend to Fig. 1, and total DNA was extracted at the times shown, digested with EcoRI which linearizes the viral genome, processed for Southern blotting, and hybridized to a 32P-labeled genomic probe as described in Materials and Methods. Samples from 4, 12, and 16 hpi were undiluted, while those from 18 to 48 hpi were diluted eightfold as shown. The cell cycle phases are shown above the lanes. Hybridized counts were determined with a PhosphorImager and corrected for dilution, and the increase relative to the input is shown for each time under each lane. HPI = hpi.
FIG. 6
FIG. 6
Transcriptional analysis of the early-to-late switch period. Cells were infected as described in the legend to Fig. 1. Samples were taken at the times shown at the top of the lanes. Cell cycle phases were determined by FACS analysis, and the percentages of the cells in S phase are shown above the genome amplification data. The DNA amplification data was analyzed as described in Fig. 5. The sample taken at 48 hpi was diluted fourfold. Total RNA was extracted, processed for Northern blotting, sequentially hybridized, and stripped with probes for the early, late, or all transcripts. For early transcripts, the blot was hybridized with a digoxigenin-substituted RNA probe (MspI fragment 4 [nt 399 to 1101]), which detects all early RNAs. For late transcripts, The blot was stripped and rehybridized with a digoxigenin-substituted RNA probe spanning nt 3918 to 2928, which detects all late RNAs. For total transcripts, the blot was hybridized to a genomic 32P-labeled DNA probe; the position of the early (▪ ▪) and late (▄) transcripts deduced by superposing the X-ray films is shown. The arrow on the right points to the small RNA. HPI = hpi.
FIG. 7
FIG. 7
VP1 capsid protein expression. The Western blot shown in Fig. 3 was stripped and reprobed with a monoclonal antibody directed against the VP1 capsid protein. The phase of cell cycle for the largest fraction of the cell population at the time of sample collection is given. HPI = hpi.
FIG. 8
FIG. 8
Live virus production. At the times shown (hpi), the production of live virus was assayed by plaque assays in the cell-associated fraction and in the cell supernatant as described in Materials and Methods. The yield of live viruses per cell was calculated. The theoretical number of viruses/cell (multiplicity) at the beginning of infection (−2 hpi) is indicated by a star. Symbols: ⧫, intracellular live virus particles; ●, live virus particles released in the cell supernatant. HPI = hpi.
FIG. 9
FIG. 9
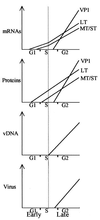
Schematic representation of the polyomavirus life cycle. The events and viral products in the lytic cycle of PYV are presented in a schematic manner. The three phases of the first cycle are shown: G1, S, and G2. The line in the center of S marks the detection of an increase in viral genomes and the transition between the early and the late phases. The following aspects are highlighted. For transcripts, the delay and lower abundance of the middle T and small T compared to the large T transcripts, the enhancement of transcription of early genes following the onset of DNA replication, the high accumulation of late transcripts (especially VP1), and the continuous increase in transcript abundance is shown. For proteins, the lower level of middle T-small T compared with large T, the delay of appearance of middle T-small T until the S phase, the appearance of VP1 following the onset of DNA replication, and the continuous increase in the abundance of all proteins is shown. Since different antibodies were used to assay VP1 and the early proteins, the relative abundance of these proteins is theoretical. For viral DNA, the delay of amplification of viral genomes to mid-S phase is highlighted.

Similar articles

Cited by

References

    1. Acheson N H. Polyoma virus giant RNAs contain tandem repeats of the nucleotide sequence of the entire viral genome. Proc Natl Acad Sci USA. 1978;68:4754–4758. - PMC - PubMed
    1. Acheson N H. Lytic cycle of SV40 and polyoma virus. In: Tooze J, editor. DNA tumor virus. Cold Spring Harbor, N.Y: Cold Spring Harbor Press; 1981. pp. 125–204.
    1. Acheson N H. Kinetics and efficiency of polyadenylation of late polyomavirus nuclear RNA: generation of oligomeric polyadenylated RNAs and their processing into mRNA. Mol Cell Biol. 1984;4:722–729. - PMC - PubMed
    1. Adami G R, Carmichael G G. The length but not the sequence of the polyoma virus late leader exon is important for both late RNA splicing and stability. Nucleic Acids Res. 1987;15:2593–2610. - PMC - PubMed
    1. Adami G R, Marlor C W, Barrett N L, Carmichael G G. Leader-to-leader splicing is required for efficient production and accumulation of polyomavirus late mRNAs. J Virol. 1989;63:85–93. - PMC - PubMed

Publication types

MeSH terms

LinkOut - more resources