Combined SSCP/duplex analysis by capillary electrophoresis for more efficient mutation detection
- PMID: 11452040
- PMCID: PMC55818
- DOI: 10.1093/nar/29.14.e71
Combined SSCP/duplex analysis by capillary electrophoresis for more efficient mutation detection
Abstract
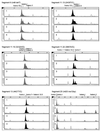
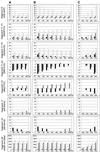
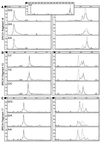
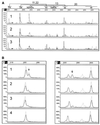
SSCP and heteroduplex analysis (HA) continue to be the most popular methods of mutation detection due to their simplicity, high sensitivity and low cost. The advantages of these methods are most clearly visible when large genes, such as BRCA1 and BRCA2, are scanned for scattered unknown mutations and/or when a large number of DNA samples is screened for specific mutations. Here we describe a novel combined SSCP/duplex analysis adapted to the modern capillary electrophoresis (CE) system, which takes advantage of multicolor labeling of DNA fragments and laser-induced fluorescence detection. In developing this method, we first established the optimum conditions for homoduplex and heteroduplex analysis by CE. These were determined based on comprehensive analysis of representative Tamra-500 markers and BRCA1 fragments at different concentrations of sieving polymer and temperatures in the presence or absence of glycerol. The intrinsic features of DNA duplex structures are discussed in detail to explain differences in the migration rates between various types of duplexes. When combined SSCP/duplex analysis was carried out in single conditions, those found to be optimal for analysis of duplexes, all 31 BRCA1 and BRCA2 mutations, polymorphisms and variants tested were detected. It is worth noting that the panel of analyzed sequence variants was enriched in base substitutions, which are usually more difficult to detect. The sensitivity of mutation detection in the SSCP portion alone was 90%, and that in the duplex portion was 81% in the single conditions of electrophoresis. As is also shown here, the proposed combined SSCP/duplex analysis by CE has the potential of being applied to the analysis of pooled genomic DNA samples, and to multiplex analysis of amplicons from different gene fragments. These modifications may further reduce the costs of analysis, making the method attractive for large scale application in SNP scanning and screening.
Figures


Similar articles
-
Single-strand conformation polymorphism analysis by capillary and microchip electrophoresis: a fast, simple method for detection of common mutations in BRCA1 and BRCA2.Genomics. 2000 Jan 1;63(1):25-34. doi: 10.1006/geno.1999.6067. Genomics. 2000. PMID: 10662541
-
Rapid mutation detection in complex genes by heteroduplex analysis with capillary array electrophoresis.Electrophoresis. 2005 Jun;26(13):2539-52. doi: 10.1002/elps.200410425. Electrophoresis. 2005. PMID: 15937982
-
High-throughput mutation detection method to scan BRCA1 and BRCA2 based on heteroduplex analysis by capillary array electrophoresis.Clin Chem. 2004 Feb;50(2):313-20. doi: 10.1373/clinchem.2003.023614. Epub 2003 Dec 18. Clin Chem. 2004. PMID: 14684619
-
Economical protocol for combined single-strand conformation polymorphism and heteroduplex analysis on a standard capillary electrophoresis apparatus.Methods Mol Biol. 2010;653:181-92. doi: 10.1007/978-1-60761-759-4_10. Methods Mol Biol. 2010. PMID: 20721743 Review.
-
Diagnostic accuracy of methods for the detection of BRCA1 and BRCA2 mutations: a systematic review.Eur J Hum Genet. 2007 Jun;15(6):619-27. doi: 10.1038/sj.ejhg.5201806. Epub 2007 Mar 7. Eur J Hum Genet. 2007. PMID: 17342152 Review.
Cited by
-
RNA structure analysis assisted by capillary electrophoresis.Nucleic Acids Res. 2002 Nov 15;30(22):e124. doi: 10.1093/nar/gnf123. Nucleic Acids Res. 2002. PMID: 12434006 Free PMC article.
-
Single nucleotide polymorphism detection by combinatorial fluorescence energy transfer tags and biotinylated dideoxynucleotides.Nucleic Acids Res. 2002 Mar 1;30(5):e19. doi: 10.1093/nar/30.5.e19. Nucleic Acids Res. 2002. PMID: 11861924 Free PMC article.
-
Rapid self-assembly of DNA on a microfluidic chip.J Nanobiotechnology. 2005 Feb 18;3(1):2. doi: 10.1186/1477-3155-3-2. J Nanobiotechnology. 2005. PMID: 15717935 Free PMC article.
-
The use of capillary electrophoresis for DNA polymorphism analysis.Mol Biotechnol. 2003 May;24(1):41-68. doi: 10.1385/MB:24:1:41. Mol Biotechnol. 2003. PMID: 12721495 Review.
-
Efficient detection, quantification and enrichment of subtle allelic alterations.DNA Res. 2012 Oct;19(5):423-33. doi: 10.1093/dnares/dss023. DNA Res. 2012. PMID: 23075543 Free PMC article.
References
-
- Krawczak M., Ball,E.V., Fenton,I., Stenson,P.D., Abeysinghe,S., Thomas,N. and Cooper,D.N. (2000) Human gene mutation database-a biomedical information and research resource. Hum. Mutat., 15, 45–51. - PubMed
-
- Shen D. and Vadgama,J.V. (1999) BRCA1 and BRCA2 gene mutation analysis: visit to the Breast Cancer Information Core (BIC). Oncol. Res., 11, 63–69. - PubMed
-
- Szabo C., Masiello,A., Ryan,J.F. and Brody,L.C. (2000) The breast cancer information core: database design, structure and scope. Hum. Mutat., 16, 123–131. - PubMed
-
- Orita M., Suzuki,Y., Sekiya,T. and Hayashi,K. (1989) Rapid and sensitive detection of point mutations and DNA polymorphisms using the polymerase chain reaction. Genomics, 5, 874–879. - PubMed
Publication types
MeSH terms
Substances
LinkOut - more resources
Full Text Sources
Research Materials
Miscellaneous

