. 2001 Jul 1;29(13):2810-21.
doi: 10.1093/nar/29.13.2810.

E2F mediates induction of the Sp1-controlled promoter of the human DNA polymerase epsilon B-subunit gene POLE2

Affiliations

E2F mediates induction of the Sp1-controlled promoter of the human DNA polymerase epsilon B-subunit gene POLE2

D Huang et al. Nucleic Acids Res. .

Abstract

The B-subunits of replicative DNA polymerases from Archaea to humans belong to the same protein family, suggesting that they share a common fundamental function. We report here the gene structure for the B-subunit of human DNA polymerase epsilon (POLE2), whose expression and transcriptional regulation is typical for replication proteins with some unique features. The 75 bp core promoter region, located within exon 1, contains an Sp1 element that is a critical determinant of promoter activity as shown by the luciferase reporter, electrophoretic mobility shift and DNase I footprinting assays. Two overlapping E2F elements adjacent to the Sp1 element are essential for full promoter activity and serum response. Binding sites for E2F1 and NF-1 reside immediately downstream from the core promoter region. Our results suggest that human POLE2 is regulated by two E2F-pocket protein complexes, one associated with Sp1 and the other with NF-1. So far, only one replicative DNA polymerase B-subunit gene promoter, POLA2 encoding the B-subunit of DNA polymerase alpha, has been characterized. Mitogenic activation of the POLE2 promoter by an E2F-mediated mechanism resembles that of POLA2, but the regulation of basal promoter activity is different between these two genes.


Figures
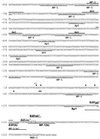
Figure 1
Figure 1
Nucleotide sequence and putative regulatory elements of the promoter region of POLE2. The putative binding elements for the transcription factors were identified using the MatInspector V2.2 program (64) in conjunction with the Transfac Matrix Table V3.3 database except for the variant E2F elements (a) and (d) that were not identified by MatInspector V2.2 (35,36). Locations of all elements are underlined, the elements on the complementary strand indicated by italics and the elements that were studied by bold letters. The transcription initiation sites were determined by primer extension and RT–PCR and are indicated by arrowheads in the figure. The translation start site (ATG) is boxed. The intron sequence is shown in lower case. The multiple start site element downstream (MED-1) is indicated by a dashed line.
Figure 2
Figure 2
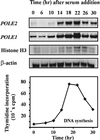
Expression of POLE2 is proliferation dependent. Steady-state mRNA levels of POLE2 were measured by the RNase protection assay. IMR-90 fibroblasts in a quiescent state induced by serum deprivation were stimulated to re-enter the cell cycle by addition of serum. Total RNA samples were isolated for RNase protection assay at the times indicated. The level of DNA synthesis in vivo was determined in parallel cultures for each time point. The mRNA levels for POLE1, β-actin and histone H3 were studied as controls.
Figure 3
Figure 3
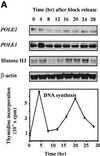
Expression of POLE2 shows only minor fluctuations during the cell cycle. (A) Steady-state mRNA levels of POLE2 from IMR-90 cells synchronized by the double thymidine block method. Cells arrested by double thymidine block were released by removing the thymidine and RNA samples were isolated at the time points shown. The mRNA levels of POLE1, β-actin and histone H3 were studied as controls. DNA synthesis activity in vivo was determined in parallel cultures from each time point. (B) Steady-state mRNA levels of POLE2 from HeLa S3 cells synchronized with nocodazole. Cells grown in suspension were arrested with nocodazole and released by removing the nocodazole. The DNA synthesis activity in vivo at the time points shown was determined and presented as described above. (C) Steady-state mRNA levels of POLE2 from HeLa S3 cells fractionated by counterflow centrifugal elutriation. Cell cycle distribution of the fractions was analyzed by flow cytometry. RNA samples from each fraction were analyzed by RNase protection assay.
Figure 3
Figure 3
Expression of POLE2 shows only minor fluctuations during the cell cycle. (A) Steady-state mRNA levels of POLE2 from IMR-90 cells synchronized by the double thymidine block method. Cells arrested by double thymidine block were released by removing the thymidine and RNA samples were isolated at the time points shown. The mRNA levels of POLE1, β-actin and histone H3 were studied as controls. DNA synthesis activity in vivo was determined in parallel cultures from each time point. (B) Steady-state mRNA levels of POLE2 from HeLa S3 cells synchronized with nocodazole. Cells grown in suspension were arrested with nocodazole and released by removing the nocodazole. The DNA synthesis activity in vivo at the time points shown was determined and presented as described above. (C) Steady-state mRNA levels of POLE2 from HeLa S3 cells fractionated by counterflow centrifugal elutriation. Cell cycle distribution of the fractions was analyzed by flow cytometry. RNA samples from each fraction were analyzed by RNase protection assay.
Figure 4
Figure 4
The deletion constructs of the putative POLE2 promoter region and their relative promoter activities in asynchronous HeLa cells. A series of deletion constructs fused to the pGL3-Basic luciferase reporter plasmid were analyzed by transient transfection of cycling HeLa CCL2 cells. Luciferase activity was normalized to β-galactosidase activity. The promoter activity of construct B1 containing the longest promoter insert is taken to be 100%. Values are the means of at least five independent experiments, each run in duplicate. The transcriptional orientation is indicated by an arrow on each construct. The Basic and Control vectors were used as negative and positive controls, respectively. The transcription initiation sites (arrowheads) and elements studied are indicated on the promoter sequence (Fig. 1).
Figure 5
Figure 5
cis elements critical for POLE2 promoter activity. (A) Co-transfection assay with Sp1 expression vector. Each deletion construct (2.0 µg) was co-transfected into cycling HeLa CCL2 cells on 28 cm2 dishes with either the human Sp1 expression vector plasmid (pEVR2/Sp1, 0.5 µg) or a control expression vector missing the Sp1 cDNA insert (pEVR2/0, 0.5 µg). The cell extracts were prepared to measure luciferase activity 30 h after transfection. Activation of the different deletion constructs by Sp1 was evaluated by comparing relative luciferase activity in the presence of pEVR2/Sp1, which expresses Sp1, to those obtained in the presence of pEVR2/0, which does not. Values are the means of four independent experiments, each run in duplicate. (B) Site mutation analysis. Promoter activities of the site-mutated constructs were analyzed by transient transfection of cycling HeLa CCL2 cells. Luciferase activity was normalized to β-galactosidase activity. Values are the means of five independent experiments, each run in duplicate. The sequence and the elements studied in the site-mutated region of the constructs are shown on the left. The mutated nucleotides are indicated by bold lower case letters.
Figure 5
Figure 5
cis elements critical for POLE2 promoter activity. (A) Co-transfection assay with Sp1 expression vector. Each deletion construct (2.0 µg) was co-transfected into cycling HeLa CCL2 cells on 28 cm2 dishes with either the human Sp1 expression vector plasmid (pEVR2/Sp1, 0.5 µg) or a control expression vector missing the Sp1 cDNA insert (pEVR2/0, 0.5 µg). The cell extracts were prepared to measure luciferase activity 30 h after transfection. Activation of the different deletion constructs by Sp1 was evaluated by comparing relative luciferase activity in the presence of pEVR2/Sp1, which expresses Sp1, to those obtained in the presence of pEVR2/0, which does not. Values are the means of four independent experiments, each run in duplicate. (B) Site mutation analysis. Promoter activities of the site-mutated constructs were analyzed by transient transfection of cycling HeLa CCL2 cells. Luciferase activity was normalized to β-galactosidase activity. Values are the means of five independent experiments, each run in duplicate. The sequence and the elements studied in the site-mutated region of the constructs are shown on the left. The mutated nucleotides are indicated by bold lower case letters.
Figure 6
Figure 6
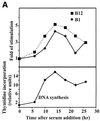
Serum stimulation of POLE2 is mediated by the E2F(a/b) element. (A) Relative promoter activities in serum-deprived NIH 3T3 cells stimulated to proliferate. Constructs B1 and B12 with different lengths of the POLE2 promoter sequence were examined for their response to serum stimulation in NIH 3T3 cells. The promoter and DNA synthesis activities in cells are presented as relative activities by taking the activities at the time of serum addition to be 1. (B) The E2F(a/b) cis element is required for full serum response in NIH 3T3 cells. The site-mutated constructs B9-E2F(a)-2nt and B9-E2F(b)-2nt were derived from construct B9, which was used as the control. The mutated sequences are shown in Figure 5B. The promoter activity and DNA synthesis in cells are presented as described above.
Figure 6
Figure 6
Serum stimulation of POLE2 is mediated by the E2F(a/b) element. (A) Relative promoter activities in serum-deprived NIH 3T3 cells stimulated to proliferate. Constructs B1 and B12 with different lengths of the POLE2 promoter sequence were examined for their response to serum stimulation in NIH 3T3 cells. The promoter and DNA synthesis activities in cells are presented as relative activities by taking the activities at the time of serum addition to be 1. (B) The E2F(a/b) cis element is required for full serum response in NIH 3T3 cells. The site-mutated constructs B9-E2F(a)-2nt and B9-E2F(b)-2nt were derived from construct B9, which was used as the control. The mutated sequences are shown in Figure 5B. The promoter activity and DNA synthesis in cells are presented as described above.
Figure 7
Figure 7
Characterization of the nuclear proteins binding to the POLE2 promoter by EMSA. (A) A schematic representation of probes and competitor oligonucleotides used. The putative binding elements of the transcription factors are indicated. The mutated nucleotides in the Sp1 (GGCGaGCt), E2F (a/b)/NF-1(a) (CGta), E2F(b)/NF-1(a) (CAAtAc), E2F(c) (CAAtAc) and E2F(d)/NF-1(b) (GGCcat) elements used in competitor oligonucleotides are shown in bold. (B) The existence of two separate DNA–protein complexes, core promoter (cp) and downstream (dr) complex, as indicated by competition assay. EMSA was performed with an end-labeled probe containing nucleotides +101 to +254 (long probe) and HeLa nuclear extract. Unlabeled competitor oligonucleotides were used in 500-fold molar excess. Note that the promoter complex containing the cp complex migrates faster when the dr complex is competed out. (C) The identities of the transcription factors binding to the core promoter and the downstream region were examined by supershift assay. EMSA was performed with either the short probe (left) or long probe (right) and HeLa nuclear extract. Specific antibodies against E2F2, E2F4, p107 and Sp1 caused supershifts of the core promoter complex as denoted by arrows. Similarly, antibodies against E2F1, pRb and NF-1 retarded the complexes binding to the downstream region. (D) Core promoter complex formation in vitro was more efficient in extracts from G1 than from G0 nuclei. EMSA was performed with the core promoter (short) probe and nuclear extract prepared from asynchronous G0 or G1 IMR-90 cells. The latter two were from serum-deprived and re-stimulated fibroblasts as described in Materials and Methods.
Figure 7
Figure 7
Characterization of the nuclear proteins binding to the POLE2 promoter by EMSA. (A) A schematic representation of probes and competitor oligonucleotides used. The putative binding elements of the transcription factors are indicated. The mutated nucleotides in the Sp1 (GGCGaGCt), E2F (a/b)/NF-1(a) (CGta), E2F(b)/NF-1(a) (CAAtAc), E2F(c) (CAAtAc) and E2F(d)/NF-1(b) (GGCcat) elements used in competitor oligonucleotides are shown in bold. (B) The existence of two separate DNA–protein complexes, core promoter (cp) and downstream (dr) complex, as indicated by competition assay. EMSA was performed with an end-labeled probe containing nucleotides +101 to +254 (long probe) and HeLa nuclear extract. Unlabeled competitor oligonucleotides were used in 500-fold molar excess. Note that the promoter complex containing the cp complex migrates faster when the dr complex is competed out. (C) The identities of the transcription factors binding to the core promoter and the downstream region were examined by supershift assay. EMSA was performed with either the short probe (left) or long probe (right) and HeLa nuclear extract. Specific antibodies against E2F2, E2F4, p107 and Sp1 caused supershifts of the core promoter complex as denoted by arrows. Similarly, antibodies against E2F1, pRb and NF-1 retarded the complexes binding to the downstream region. (D) Core promoter complex formation in vitro was more efficient in extracts from G1 than from G0 nuclei. EMSA was performed with the core promoter (short) probe and nuclear extract prepared from asynchronous G0 or G1 IMR-90 cells. The latter two were from serum-deprived and re-stimulated fibroblasts as described in Materials and Methods.
Figure 8
Figure 8
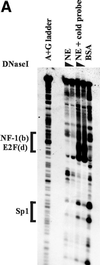
In vitro DNase I footprint analysis of POLE2 promoter DNA. Single-end 32P-labeled POLE2 DNA was incubated with nuclear extracts from asynchronous HeLa S3 cells and then digested with various amounts of DNase I. The protected cis-acting elements indicated on the left were determined by comparison with the sequencing G+A ladder. NE, nuclear extracts; BSA, bovine serum albumin, used as a negative control. Unlabeled probe was added in molar excess (120 ng) as a specific competitor. (A) Analysis of the sense strand POLE2 promoter DNA. (B) Analysis of the antisense strand POLE2 promoter DNA.
Figure 8
Figure 8
In vitro DNase I footprint analysis of POLE2 promoter DNA. Single-end 32P-labeled POLE2 DNA was incubated with nuclear extracts from asynchronous HeLa S3 cells and then digested with various amounts of DNase I. The protected cis-acting elements indicated on the left were determined by comparison with the sequencing G+A ladder. NE, nuclear extracts; BSA, bovine serum albumin, used as a negative control. Unlabeled probe was added in molar excess (120 ng) as a specific competitor. (A) Analysis of the sense strand POLE2 promoter DNA. (B) Analysis of the antisense strand POLE2 promoter DNA.
Figure 9
Figure 9
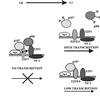
A model of regulation of the POLE2 promoter. The region containing Sp1, E2F and NF1 elements is occupied by multiprotein complexes in both quiescent and cycling cells. A dramatic increase in promoter activity takes place during G0→G1. We propose that two E2F–pocket protein complexes repress transcription in quiescent cells, one containing p107 and the other pRb. After a mitogenic stimulus, cyclinD-Cdk4/6 phosphorylates the pocket proteins, disrupting these complexes. The level of promoter activity in cycling cells may result from modulation of species of bound E2Fs and pocket proteins. Sp1 is essential for promoter activity in cycling cells and may interact with E2F1 to form a repressive complex in quiescent cells.

Similar articles

Cited by

References

    1. Burgers P.M. (1998) Eukaryotic DNA polymerases in DNA replication and DNA repair. Chromosoma, 107, 218–227. - PubMed
    1. Hübscher U., Nasheuer,H.-P. and Syväoja,J.E. (2000) Eukaryotic DNA polymerases, a growing family. Trends Biochem. Sci., 25, 143–147. - PubMed
    1. Wang T.S.-F. (1996) Cellular DNA polymerases. In Depamphilis,M.L. (ed.), DNA Replication in Eukaryotic Cells. Cold Spring Harbor Laboratory Press, Cold Spring Harbor, NY, pp. 461–493.
    1. Foiani M., Marini,F., Gamba,D., Lucchini,G. and Plevani,P. (1994) The B subunit of the DNA polymerase alpha-primase complex in Saccharomyces cerevisiae executes an essential function at the initial stage of DNA replication. Mol. Cell. Biol., 14, 923–933. - PMC - PubMed
    1. Hashimoto K., Nakashima,N., Ohara,T., Maki,S. and Sugino,A. (1998) The second subunit of DNA polymerase III (delta) is encoded by the HYS2 gene in Saccharomyces cerevisiae. Nucleic Acids Res., 15, 477–485. - PMC - PubMed

Publication types

MeSH terms