Role for E2F in control of both DNA replication and mitotic functions as revealed from DNA microarray analysis
- PMID: 11416145
- PMCID: PMC87143
- DOI: 10.1128/MCB.21.14.4684-4699.2001
Role for E2F in control of both DNA replication and mitotic functions as revealed from DNA microarray analysis
Abstract
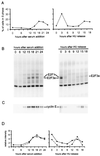
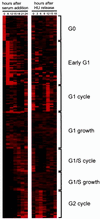
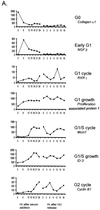
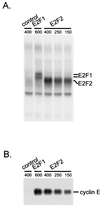
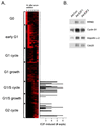
We have used high-density DNA microarrays to provide an analysis of gene regulation during the mammalian cell cycle and the role of E2F in this process. Cell cycle analysis was facilitated by a combined examination of gene control in serum-stimulated fibroblasts and cells synchronized at G(1)/S by hydroxyurea block that were then released to proceed through the cell cycle. The latter approach (G(1)/S synchronization) is critical for rigorously maintaining cell synchrony for unambiguous analysis of gene regulation in later stages of the cell cycle. Analysis of these samples identified seven distinct clusters of genes that exhibit unique patterns of expression. Genes tend to cluster within these groups based on common function and the time during the cell cycle that the activity is required. Placed in this context, the analysis of genes induced by E2F proteins identified genes or expressed sequence tags not previously described as regulated by E2F proteins; surprisingly, many of these encode proteins known to function during mitosis. A comparison of the E2F-induced genes with the patterns of cell growth-regulated gene expression revealed that virtually all of the E2F-induced genes are found in only two of the cell cycle clusters; one group was regulated at G(1)/S, and the second group, which included the mitotic activities, was regulated at G(2). The activation of the G(2) genes suggests a broader role for E2F in the control of both DNA replication and mitotic activities.
Figures


Similar articles
-
E2F integrates cell cycle progression with DNA repair, replication, and G(2)/M checkpoints.Genes Dev. 2002 Jan 15;16(2):245-56. doi: 10.1101/gad.949802. Genes Dev. 2002. PMID: 11799067 Free PMC article.
-
Expression analysis using DNA microarrays demonstrates that E2F-1 up-regulates expression of DNA replication genes including replication protein A2.Oncogene. 2001 Mar 15;20(11):1379-87. doi: 10.1038/sj.onc.1204230. Oncogene. 2001. PMID: 11313881
-
Cell growth-regulated expression of mammalian MCM5 and MCM6 genes mediated by the transcription factor E2F.Oncogene. 1999 Apr 8;18(14):2299-309. doi: 10.1038/sj.onc.1202544. Oncogene. 1999. PMID: 10327050
-
E2F target genes and cell-cycle checkpoint control.Bioessays. 1999 Mar;21(3):221-30. doi: 10.1002/(SICI)1521-1878(199903)21:3<221::AID-BIES6>3.0.CO;2-J. Bioessays. 1999. PMID: 10333731 Review.
-
E2F target genes: unraveling the biology.Trends Biochem Sci. 2004 Aug;29(8):409-17. doi: 10.1016/j.tibs.2004.06.006. Trends Biochem Sci. 2004. PMID: 15362224 Review.
Cited by
-
Epstein-Barr virus replication within differentiated epithelia requires pRb sequestration of activator E2F transcription factors.J Virol. 2024 Oct 22;98(10):e0099524. doi: 10.1128/jvi.00995-24. Epub 2024 Sep 18. J Virol. 2024. PMID: 39291960
-
Deriving transcriptional programs and functional processes from gene expression databases.Bioinformatics. 2012 Apr 15;28(8):1122-9. doi: 10.1093/bioinformatics/bts112. Epub 2012 Mar 8. Bioinformatics. 2012. PMID: 22408194 Free PMC article.
-
dDP is needed for normal cell proliferation.Mol Cell Biol. 2005 Apr;25(8):3027-39. doi: 10.1128/MCB.25.8.3027-3039.2005. Mol Cell Biol. 2005. PMID: 15798191 Free PMC article.
-
Adaptively inferring human transcriptional subnetworks.Mol Syst Biol. 2006;2:2006.0029. doi: 10.1038/msb4100067. Epub 2006 Jun 6. Mol Syst Biol. 2006. PMID: 16760900 Free PMC article.
-
A new E6/P63 pathway, together with a strong E7/E2F mitotic pathway, modulates the transcriptome in cervical cancer cells.J Virol. 2007 Sep;81(17):9368-76. doi: 10.1128/JVI.00427-07. Epub 2007 Jun 20. J Virol. 2007. PMID: 17582001 Free PMC article.
References
-
- Cho R J, Campbell M J, Winzeler E A, Steinmetz L, Conway A, Wodicka L, Wolfsberg T G, Gabrielian A E, Landsman D, Lockhart D J, Davis R W. A genome-wide transcriptional analysis of the mitotic cell cycle. Mol Cell. 1998;2:65–73. - PubMed
-
- Cho R J, Huang M, Campbell M J, Dong H, Steinmetz L, Sapinoso L, Hampton G, Elledge S J, Davis R W, Lockhart D J. Transcriptional regulation and function during the human cell cycle. Nat Genet. 2001;27:48–54. - PubMed
-
- Dyson N. The regulation of E2F by pRB-family proteins. Genes Dev. 1998;12:2245–2262. - PubMed
MeSH terms
Substances
LinkOut - more resources
Full Text Sources
Other Literature Sources
