

Classification and diagnostic prediction of cancers using gene expression profiling and artificial neural networks
- PMID: 11385503
- PMCID: PMC1282521
- DOI: 10.1038/89044
Classification and diagnostic prediction of cancers using gene expression profiling and artificial neural networks
Abstract
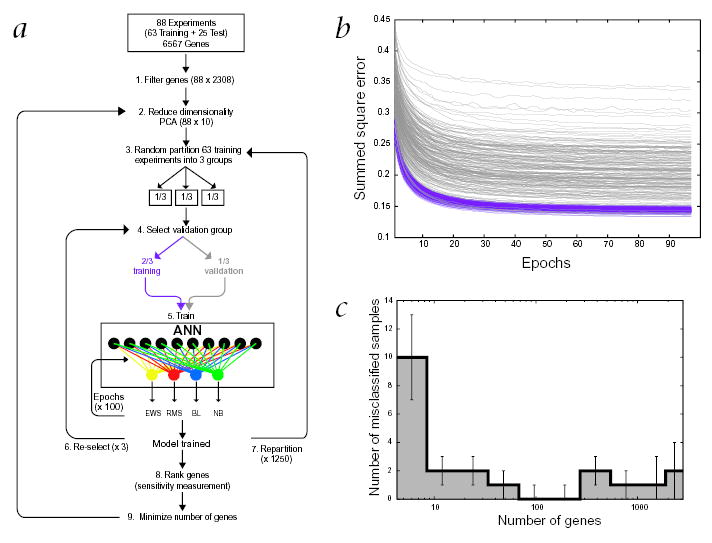
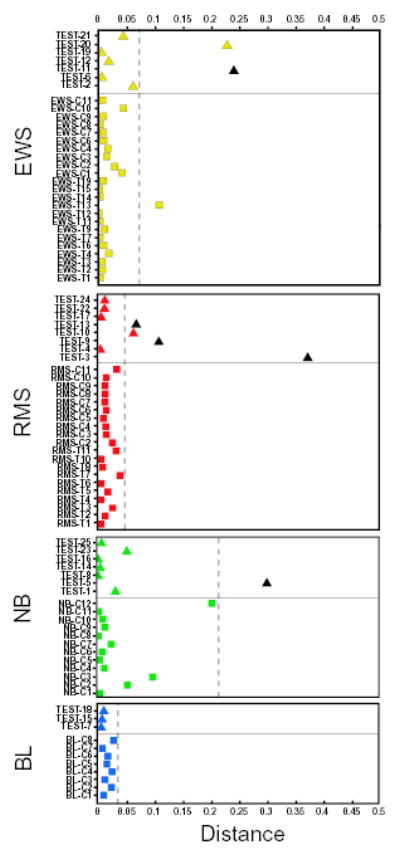
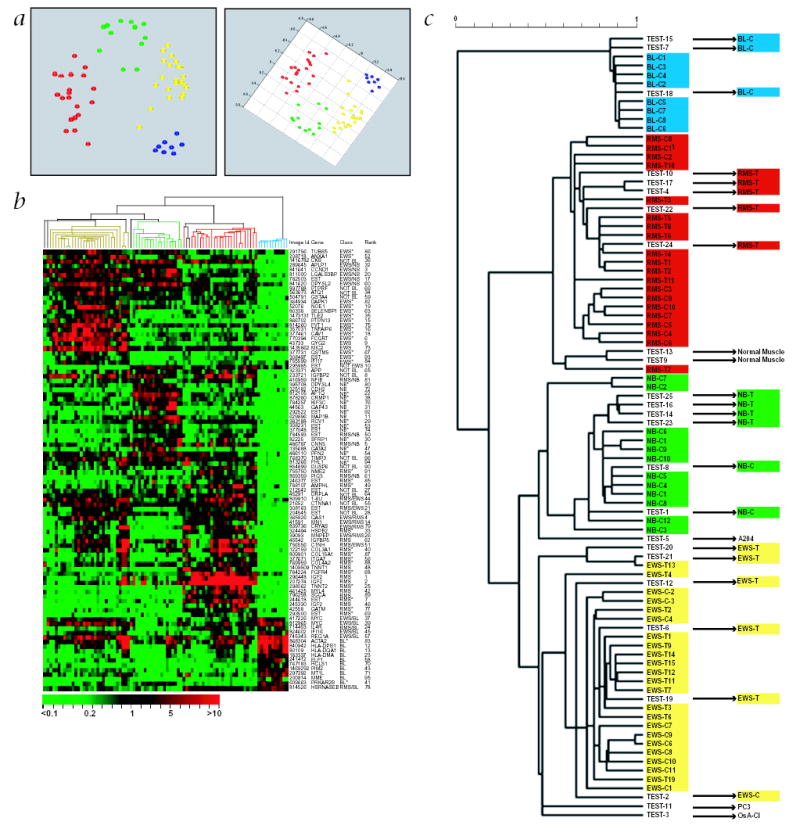
The purpose of this study was to develop a method of classifying cancers to specific diagnostic categories based on their gene expression signatures using artificial neural networks (ANNs). We trained the ANNs using the small, round blue-cell tumors (SRBCTs) as a model. These cancers belong to four distinct diagnostic categories and often present diagnostic dilemmas in clinical practice. The ANNs correctly classified all samples and identified the genes most relevant to the classification. Expression of several of these genes has been reported in SRBCTs, but most have not been associated with these cancers. To test the ability of the trained ANN models to recognize SRBCTs, we analyzed additional blinded samples that were not previously used for the training procedure, and correctly classified them in all cases. This study demonstrates the potential applications of these methods for tumor diagnosis and the identification of candidate targets for therapy.
Figures
Comment in
-
Microarrays--the 21st century divining rod?Nat Med. 2001 Jun;7(6):658-9. doi: 10.1038/89022. Nat Med. 2001. PMID: 11385496 No abstract available.
Similar articles
-
Chips help diagnosis of childhood cancers.Trends Cell Biol. 2001 Aug;11(8):323. doi: 10.1016/s0962-8924(01)02078-5. Trends Cell Biol. 2001. PMID: 11489636 No abstract available.
-
Tumor classification by combining PNN classifier ensemble with neighborhood rough set based gene reduction.Comput Biol Med. 2010 Feb;40(2):179-89. doi: 10.1016/j.compbiomed.2009.11.014. Epub 2009 Dec 30. Comput Biol Med. 2010. PMID: 20044083
-
PCA disjoint models for multiclass cancer analysis using gene expression data.Bioinformatics. 2003 Mar 22;19(5):571-8. doi: 10.1093/bioinformatics/btg051. Bioinformatics. 2003. PMID: 12651714
-
[Cytopathology of malignant blastematous tumors].Ann Pathol. 2004 Dec;24(6):568-73. doi: 10.1016/s0242-6498(04)94019-9. Ann Pathol. 2004. PMID: 15785403 Review. French.
-
Rhabdomyosarcoma, Ewing Sarcoma, and Other Round Cell Sarcomas.J Clin Oncol. 2018 Jan 10;36(2):168-179. doi: 10.1200/JCO.2017.74.7402. Epub 2017 Dec 8. J Clin Oncol. 2018. PMID: 29220292 Review.
Cited by
-
Non-negative matrix factorization by maximizing correntropy for cancer clustering.BMC Bioinformatics. 2013 Mar 24;14:107. doi: 10.1186/1471-2105-14-107. BMC Bioinformatics. 2013. PMID: 23522344 Free PMC article.
-
Prediction of lung tumor types based on protein attributes by machine learning algorithms.Springerplus. 2013 May 24;2(1):238. doi: 10.1186/2193-1801-2-238. Print 2013 Dec. Springerplus. 2013. PMID: 23888262 Free PMC article.
-
Gene selection approach based on improved swarm intelligent optimisation algorithm for tumour classification.IET Syst Biol. 2016 Jun;10(3):107-15. doi: 10.1049/iet-syb.2015.0064. IET Syst Biol. 2016. PMID: 27187989 Free PMC article.
-
Prediction of Early Recurrence of Liver Cancer by a Novel Discrete Bayes Decision Rule for Personalized Medicine.Biomed Res Int. 2016;2016:8567479. doi: 10.1155/2016/8567479. Epub 2016 Oct 9. Biomed Res Int. 2016. PMID: 27800494 Free PMC article.
-
Advanced bone formation in mice with a dominant-negative mutation in the thyroid hormone receptor β gene due to activation of Wnt/β-catenin protein signaling.J Biol Chem. 2012 May 18;287(21):17812-17822. doi: 10.1074/jbc.M111.311464. Epub 2012 Mar 22. J Biol Chem. 2012. PMID: 22442145 Free PMC article.
References
-
- Pizzo, P.A. Principles and practice of pediatric oncology (Lippincott-Raven, Philadelphia, 1997).
-
- Triche TJ, Askin FB. Neuroblastoma and the differential diagnosis of small-, round-, blue- cell tumors. Hum Pathol. 1983;14:569–595. - PubMed
-
- McManus AP, Gusterson BA, Pinkerton CR, Shipley JM. The molecular pathology of small round-cell tumours—relevance to diagnosis, prognosis, and classification. J Pathol. 1996;178:116–121. - PubMed
-
- Khan J, et al. Gene expression profiling of alveolar rhabdomyosarcoma with cDNA microarrays. Cancer Res. 1998;58:5009–5013. - PubMed
Publication types
MeSH terms
Grants and funding
LinkOut - more resources
Full Text Sources
Other Literature Sources
