. 2001 Apr 15;21(8):2687-98.
doi: 10.1523/JNEUROSCI.21-08-02687.2001.

Rapid signaling at inhibitory synapses in a dentate gyrus interneuron network

Affiliations

Rapid signaling at inhibitory synapses in a dentate gyrus interneuron network

M Bartos et al. J Neurosci. .

Abstract

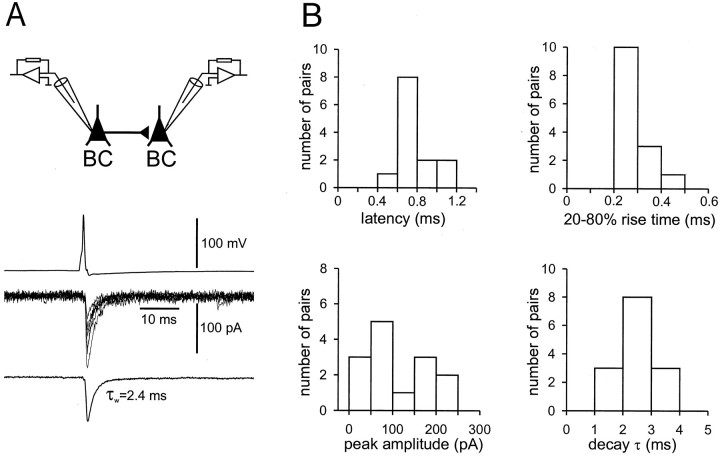
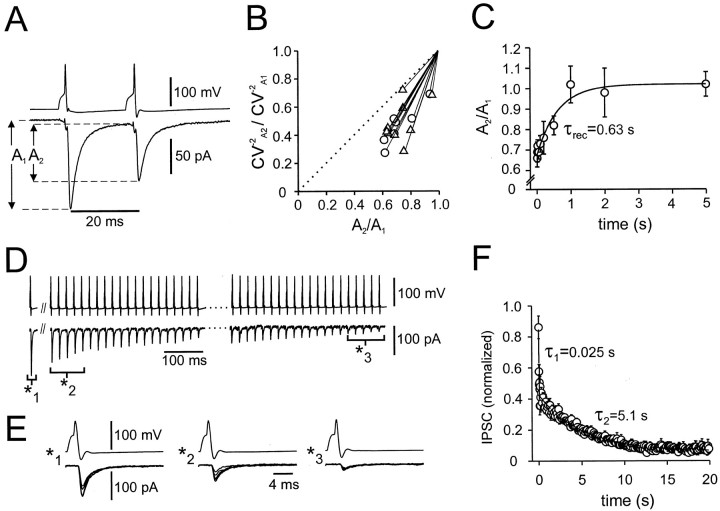
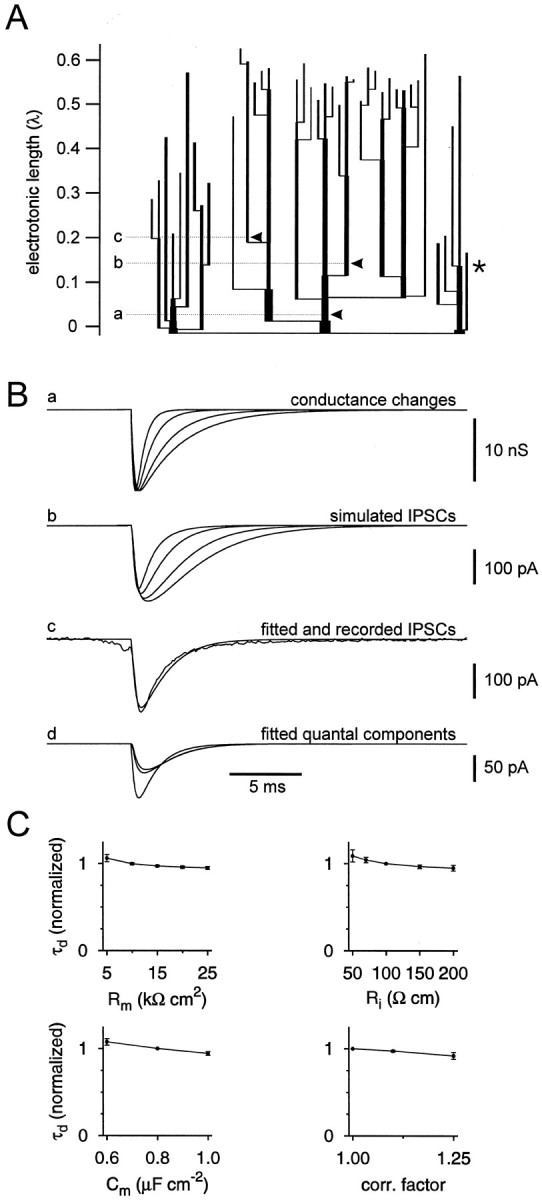
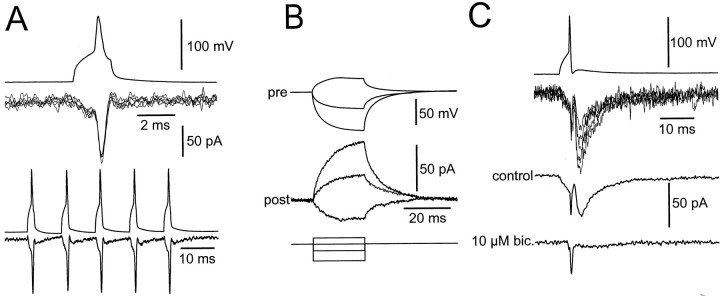
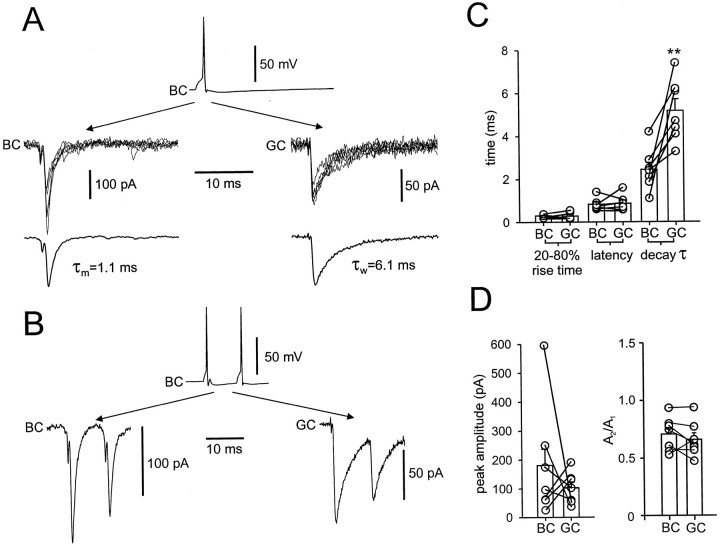
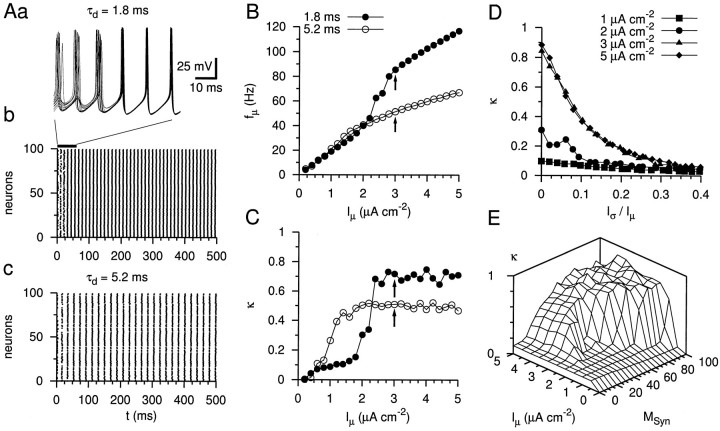
Mutual synaptic interactions between GABAergic interneurons are thought to be of critical importance for the generation of network oscillations and for temporal encoding of information in the hippocampus. However, the functional properties of synaptic transmission between hippocampal interneurons are largely unknown. We have made paired recordings from basket cells (BCs) in the dentate gyrus of rat hippocampal slices, followed by correlated light and electron microscopical analysis. Unitary GABA(A) receptor-mediated IPSCs at BC-BC synapses recorded at the soma showed a fast rise and decay, with a mean decay time constant of 2.5 +/- 0.2 msec (32 degrees C). Synaptic transmission at BC-BC synapses showed paired-pulse depression (PPD) (32 +/- 5% for 10 msec interpulse intervals) and multiple-pulse depression during repetitive stimulation. Detailed passive cable model simulations based on somatodendritic morphology and localization of synaptic contacts further indicated that the conductance change at the postsynaptic site was even faster, decaying with a mean time constant of 1.8 +/- 0.6 msec. Sequential triple recordings revealed that the decay time course of IPSCs at BC-BC synapses was approximately twofold faster than that at BC-granule cell synapses, whereas the extent of PPD was comparable. To examine the consequences of the fast postsynaptic conductance change for the generation of oscillatory activity, we developed a computational model of an interneuron network. The model showed robust oscillations at frequencies >60 Hz if the excitatory drive was sufficiently large. Thus the fast conductance change at interneuron-interneuron synapses may promote the generation of high-frequency oscillations observed in the dentate gyrus in vivo.


Figures

Fig. 1.
Fig. 1.
Fast unitary IPSCs in synaptically connected BC–BC pairs. A, Presynaptic action potential (top), single unitary IPSCs (6 sweeps superimposed,center), and average IPSC (from 38 sweeps,bottom) at −70 mV are depicted. The schematic illustration on top illustrates the recording configuration. B, Histograms of latencies, 20–80% rise times, peak amplitudes of average unitary IPSCs (including failures), and decay time constants [amplitude-weighted mean decay time constant τw (biexponential fit) in 11 pairs and τm(monoexponential fit) in 3 pairs]. Values of latencies, rise times, amplitudes, and decay time constants were determined from average IPSCs (including >10 individual traces). For latency measurements, one pair was excluded because of high presynaptic series resistance. Shown are summary graphs of data from 14 rigorously identified BC–BC pairs.
Fig. 2.
Fig. 2.
Dynamics of transmission at inhibitory BC–BC synapses. A, PPD of IPSCs. IPSCs were evoked by two action potentials in the presynaptic BC, separated by a 20 msec interval. IPSCs shown are averages from 30 single traces (failures included). A1 andA2 were measured from the preceding baseline. B, Coefficient-of-variation analysis of PPD. The inverse of the square of the coefficient of variation (CV2) of the amplitude of the second IPSC (A2) was plotted against the mean peak amplitude; data were normalized by the CV2 and mean, respectively, of the amplitude of the first IPSC (A1). Interpulse interval was 20 msec (▵) or 50 msec (○). Dotted line indicates identity line. Data are from 17 pairs.C, Time course of recovery from PPD. Amplitude ratioA2/A1of unitary IPSC was plotted against the interpulse interval. Thecurve represents a fitted monoexponential function with a time constant of 0.63 sec. Data are from 17 pairs. D, Multiple-pulse depression of IPSCs. The bottom trace to the left of the double slash is an average of 10 single sweeps recorded with a stimulation frequency of 0.2 Hz; the traces to the right of thedouble slash are single sweeps (20 events at the onset, 20 events 1 sec after the onset of a 50 Hz train).E, Unitary IPSCs at an expanded time scale from the same pair as shown in D. Five consecutive IPSCs from different times (as indicated by brackets) are shown superimposed. F, Onset of depression during a 50 Hz train. Each data point represents the mean IPSC peak amplitude in three pairs, normalized to the mean peak amplitude at 0.2 Hz (479 pA on average) before the train. Each data point represents a single peak amplitude (first 10 points) or the mean of four amplitudes (all subsequent points). The curve represents the sum of two exponential components and a constant fitted to the data points, with τ1 = 25 msec (A = 0.42), τ2 = 5.1 sec (B = 0.37), and a constant component amplitude of 0.06.
Fig. 3.
Fig. 3.
Camera lucida reconstruction of a synaptically connected BC–BC pair. Soma and dendrites of the presynaptic BC are drawn in green. Axonal arborization of the presynaptic BC is drawn in red. Soma and dendrites of the postsynaptic BC are drawn in black. Axonal arborization of the postsynaptic BC is drawn in blue. Only the portions of the axons that could be unequivocally traced back to the soma are depicted. Synaptic contacts (confirmed by subsequent electron microscopy; see Fig. 4) are indicated by arrowheads. Additionally, the postsynaptic BC showed three autaptic contacts (confirmed by electron microscopy; data not shown). Note that the axonal arborization of both BCs was largely confined to the granule cell layer, identifying them as BCs. ml, Molecular layer; gcl, granule cell layer.
Fig. 4.
Fig. 4.
Light and correlated electron microscopical analysis of synaptic contacts in a synaptically connected BC–BC pair.A, Low-power light micrograph of the same pair shown in Figure 3. ml, Molecular layer; gcl, granule cell layer; h, hilus. Scale bar, 50 μm.B, High-power light micrograph of the soma and apical dendrite of the postsynaptic BC. Two of the three synaptic contacts in this BC–BC pair are indicated by arrow and open arrow. Scale bar, 10 μm. C, Low-power electron micrograph of the proximal synaptic contact (open arrow). Scale bar, 2.5 μm. D,E, High-power electron micrographs of the two distal contacts (arrow and arrowhead). Contacts indicated by open arrow and arrow inC and D are also visible in the micrograph in B (same symbolic code; contact inE indicated by arrowhead is not shown inB). Scale bar, 0.25 μm.
Fig. 5.
Fig. 5.
Estimation of the time course of the postsynaptic conductance change at the synaptic contacts. A, Electrotonic dendrogram of a postsynaptic BC (same cell as shown in Figs. 3, 4). Apical dendrites are represented in the center; basal dendrites are shown laterally in the dendrogram. The axon (shown truncated) is indicated by the asterisk; 150 schematic collaterals were attached to the main axon in a distributed manner (not shown). The locations of the synaptic contacts are shown byarrowheads (a, b, c). The physical and electrotonic distances of the three synaptic contacts from the soma were 17, 108, and 133 μm, and 0.03, 0.14, and 0.20 λ, respectively. B, Simulation of IPSCs in voltage-clamp mode. a, Postsynaptic conductance changes, with τrise = 0.2 msec, τdecay = 0.5, 1, 2, and 3 msec, and gmax = 15.8 nS (total conductance change for all sites). b, Resulting simulated IPSCs in the pipette compartment. Conductance changes were generated simultaneously and were assumed to have the same amplitude at all sites. c, Simulated IPSC in the pipette compartment, superimposed with the recorded average unitary IPSC in the same BC–BC pair. The postsynaptic conductance change had a τrise = 0.2 msec, τdecay = 1.02 msec, and gmax = 15.8 nS (total conductance change for all sites), which represent the results of a minimization of the sum of squares of differences between simulated and measured IPSCs. d, Quantal components of the fitted IPSCs in the pipette compartment; same parameters as inc. Note that attenuation and filtering is more pronounced for distal than for proximal sites. C, Exploration of the dependence of the fit results on the parameters of the cable model. The obtained decay time constants (τd) of the conductance change at the postsynaptic site is plotted versusRm,Ri,Cm, and tissue shrinkage correction factor. τd was normalized to the respective value for default parameters (Rm determined individually, Ri = 100 Ω cm, andCm = 0.8 μF/cm2).
Fig. 6.
Fig. 6.
Electrical coupling in a subset of BC–BC pairs. A, Top panel, Electrical PSCs evoked by single presynaptic action potentials in a tentatively identified BC–BC pair. Presynaptic action potential is shown attop; single electrical PSCs are shown atbottom; six sweeps are superimposed. A,Bottom panel, Electrical PSCs evoked by a train of five presynaptic action potentials evoked with a frequency of 100 Hz (average from 15 sweeps). Note that the amplitude of the electrical PSCs is approximately constant and that the electrical PSCs are mirror images of the presynaptic action potentials. B, Postsynaptic voltage changes evoked by long depolarizing and hyperpolarizing current pulses (0.4, −0.4, and −1 nA) applied to the presynaptic interneuron. Presynaptic voltage (top), corresponding postsynaptic current (center), and pulse protocol (bottom) are depicted. Note that the current–response in the postsynaptic cell is an approximate mirror image of the voltage change in the presynaptic neuron. Same pair as in A is shown. C, Combined electrical and chemical transmission in another tentatively identified BC–BC pair. Presynaptic action potential (top), single electrical and chemical PSC traces (5 sweeps superimposed), average (from 15 sweeps), and average in the presence of 10 μm bicuculline methiodide (from 25 sweeps;bottom) are illustrated.
Fig. 7.
Fig. 7.
IPSC decay time constant is determined by the type of the postsynaptic target cell. A, B, Sequential triple recording from a presynaptic BC and a postsynaptic BC (left traces, first pair) and the same presynaptic BC and a postsynaptic GC (right traces, second pair obtained subsequently after pipette removal from the postsynaptic BC). Presynaptic action potential (top), single unitary IPSCs (6 sweeps superimposed, center), and average IPSC (from 22 sweeps, bottom) are depicted. Shown are single action potential in A and pair of two action potentials inB (10 msec interpulse interval). Note the difference in decay time constants but the comparable paired-pulse ratio. The fast inward current preceding the IPSC in the BC–BC traces represents putative electrical coupling. C, Summary bar graphs of 20–80% rise time, latency, and amplitude-weighted average decay time constant. D, Summary bar graphs of peak IPSC amplitude (left) and paired-pulse ratio (A2/A1, 10 msec interval, right). Bars indicate means (with SEMs). Data from seven sequential triple recordings;circles connected by lines represent data from the same triple recording. Note a significant difference in the decay time constant (**p ≤ 0.006), determined by the type of the postsynaptic target cell.
Fig. 8.
Fig. 8.
Simulation of oscillatory activity in the gamma frequency range in a network of interneurons coupled by fast inhibitory synapses. Aa, Ab, Simulated voltage traces of 15 neurons and rastergram representation of the activity of a network of 100 neurons connected randomly by rapid synapses (synaptic delay 0.8 msec; τd = 1.8 msec;gSyn = 0.02 mS/cm2;MSyn = 60). The excitatory driving current was heterogeneously distributed withIμ = 3 μA/cm2and Iς = 0.09 μA/cm2. Ac, Rastergram of the activity of a network coupled by slow inhibitory synapses (τd = 5.2 msec), as observed at the BC–GC synapse. Note the lower network frequency. Also note that the activity of 13 neurons is suppressed. B, C, Mean network frequency (fμ, B) and coherence (κ, C), plotted against the mean current drive (Iμ,Iς/Iμ = 0.03) for fast (τd = 1.8 msec, ●) and slow decay time constant of the inhibitory postsynaptic conductance change (τd = 5.2 msec, ○). Arrows indicate data points corresponding to the rastergrams shown in Ab and Ac. D, Coherence κ plotted against the heterogeneity measureIς/Iμ of the current drive for Iμ = 1, 2, 3, and 5 μA/cm2 (▪, ●, ▴, and ♦, respectively).E, Plot of network coherence κ versusMSyn and Iμ. Coherence κ increases with both MSyn andIμ. Note that critical values of the two parameters for the generation of coherent oscillations are interdependent.

Similar articles

Cited by

References

    1. Acsády L, Katona I, Martínez-Guijarro FJ, Buzsáki G, Freund TF. Unusual target selectivity of perisomatic inhibitory cells in the hilar region of the rat hippocampus. J Neurosci. 2000;20:6907–6919. - PMC - PubMed
    1. Bragin A, Jandó G, Nádasdy Z, Hetke J, Wise K, Buzsáki G. Gamma (40–100 Hz) oscillation in the hippocampus of the behaving rat. J Neurosci. 1995;15:47–60. - PMC - PubMed
    1. Buhl EH, Halasy K, Somogyi P. Diverse sources of hippocampal unitary inhibitory postsynaptic potentials and the number of synaptic release sites. Nature. 1994;368:823–828. - PubMed
    1. Buzsáki G, Chrobak JJ. Temporal structure in spatially organized neuronal ensembles: a role for interneuronal networks. Curr Opin Neurobiol. 1995;5:504–510. - PubMed
    1. Caillard O, Moreno H, Schwaller B, Llano I, Celio MR, Marty A. Role of the calcium-binding protein parvalbumin in short-term synaptic plasticity. Proc Natl Acad Sci USA. 2000;97:13372–13377. - PMC - PubMed

Publication types

MeSH terms

LinkOut - more resources