. 2001 Apr;75(8):3925-36.
doi: 10.1128/JVI.75.8.3925-3936.2001.

Sequence requirements for interaction of human herpesvirus 7 origin binding protein with the origin of lytic replication

Affiliations

Sequence requirements for interaction of human herpesvirus 7 origin binding protein with the origin of lytic replication

L T Krug et al. J Virol. 2001 Apr.

Abstract

As do human herpesvirus 6 variants A and B (HHV-6A and -6B), HHV-7 encodes a homolog of the alphaherpesvirus origin binding protein (OBP), which binds at sites in the origin of lytic replication (oriLyt) to initiate DNA replication. In this study, we sought to characterize the interaction of the HHV-7 OBP (OBP(H7)) with its cognate sites in the 600-bp HHV-7 oriLyt. We expressed the carboxyl-terminal domain of OBP(H7) and found that amino acids 484 to 787 of OBP(H7) were sufficient for DNA binding activity by electrophoretic mobility shift analysis. OBP(H7) has one high-affinity binding site (OBP-2) located on one flank of an AT-rich spacer element and a low-affinity site (OBP-1) on the other. This is in contrast to the HHV-6B OBP (OBP(H6B)), which binds with similar affinity to its two cognate OBP sites in the HHV-6B oriLyt. The minimal recognition element of the OBP-2 site was mapped to a 14-bp sequence. The OBP(H7) consensus recognition sequence of the 9-bp core, BRTYCWCCT (where B is a T, G, or C; R is a G or A; Y is a T or C; and W is a T or A), overlaps with the OBP(H6B) consensus YGWYCWCCY and establishes YCWCC as the roseolovirus OBP core recognition sequence. Heteroduplex analysis suggests that OBP(H7) interacts along one face of the DNA helix, with the major groove, as do OBP(H6B) and herpes simplex virus type 1 OBP. Together, these results illustrate both conserved and divergent DNA binding properties between OBP(H7) and OBP(H6B).


Figures

FIG. 1
FIG. 1
The oriLyt regions of HHV-7 and HHV-6B. The HHV-7 minimal origin as defined from plasmid (27) and amplicon (24) constructs includes two OBP sites flanking an AT-rich spacer element (described in this report). The HHV-6B minimal efficient origin determined by transient replication analysis (7) and a region found amplified in some cell culture passages of HHV-6B(Z29) (26) contains a G+C-rich region and IDRs to the right of the OBP sites. Coordinates are derived from HHV-7(RK) and HHV-6B(Z29).
FIG. 2
FIG. 2
RT-PCR detection of HHV-7(SB) U73 (OBPH7) transcripts. Lanes 1 and 10 contain a 100-bp DNA ladder (New England Biolabs, Inc., Beverly, Mass.). Lanes 2 and 3 contain HHV-6B(Z29) and HHV-7(SB) viral nucleocapsid DNA, respectively. Lanes 4 and 5 and lanes 6 and 7 contain the PCR products of reactions with uninfected SupT1 RNA and HHV-7(SB)-infected SupT1 RNA, respectively. Lanes 8 and 9 are no-template negative controls. RT was added to lanes 5, 7, and 9. The upper and lower panels contain PCR products obtained using U73 and GAPDH primers, respectively.
FIG. 3
FIG. 3
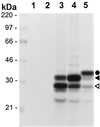
In vitro expression of truncated OBPH7. IVTT mixtures programmed with pCMV-Tag 2B vector DNA (lane 1), pcDNA3 with truncated U73 in the reverse orientation (lane 2), or plasmids containing the carboxyl-terminal region (aa 484 to 787) of HHV-7 U73 (lanes 3 to 5) were incubated in the presence of [35S]methionine and analyzed by sodium dodecyl sulfate-polyacrylamide gel electrophoresis as described previously (14). OBPH7 was expressed from pcDNA3 constructs either lacking (lane 3) or containing (lane 4) a Kozak translation initiation sequence. Lane 5 contains N-terminally FLAG-tagged OBPH7 expressed from pCMV-Tag 2B. The circle indicates the 37-kDa FLAG-tagged OBPH7 fusion protein. The solid and open triangles indicate the 33- and 29-kDA products generated from constructs containing the carboxyl-terminal portion of HHV-7 U73.
FIG. 4
FIG. 4
Identification of an OBPH7-binding site in the HHV-7 oriLyt. (A) Schematic diagram of the genomic location of the 600-bp HHV-7 minimal oriLyt region (27). The triangles indicate the putative HHV-7 OBP-2 and OBP-1 sites. (B) The 18 double-stranded 55-bp oligonucleotides ( to 18) shown in panel A were used for EMSA. 32P-labeled oligonucleotides were reacted with IVTT lysate programmed with truncated U73 in the reverse orientation (negative control, left lane for each oligonucleotide) or with truncated U73 in the correct forward orientation (right lane for each oligonucleotide). Asterisks indicate oligonucleotides with the putative OBP-2 and OBP-1 sites. Oligonucleotide 13 labeled inefficiently to lower specific activity; no specific binding was detected upon long exposure or by PhosphorImager analysis (data not shown). The arrowhead indicates the complex generated in the presence of oligonucleotide 4 and OBPH7-containing IVTT.
FIG. 5
FIG. 5
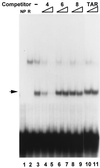
Specificity of the OBPH7 protein–OBP-2 DNA interaction by competitive EMSA. OBPH7 binding to oligonucleotides 4, 6, and 8 (Fig. 4) was analyzed in competition analysis. Sixteen- and 80-fold molar excesses of the oligonucleotides were added as competitors for binding to labeled oligonucleotide 4. Oligonucleotide 8 and TAR are double-stranded oligonucleotides with no sequence similarity to an OBP site. NP, no protein added to the binding reaction; R, binding reaction contained protein from an IVTT reaction mixture programmed with a plasmid containing HHV-7 U73 in the reverse orientation; −, no competitor present; arrow, the specific shift with OBPH7.
FIG. 6
FIG. 6
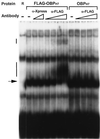
Specificity of the OBPH7 protein–OBP-2 DNA interaction by supershift. OBPH7 was incubated with increasing amounts of MAbs against the Xpress (Invitrogen) or FLAG (Stratagene) epitope before the addition of the labeled 7–2 oligonucleotide (see Fig. 7C) containing the HHV-7 OBP-2 site. The triangles below α-Xpress indicate 97.6 pg and 6.25 ng of input IgG MAb. The triangles below α-FLAG indicate the addition of 97.6 pg, 0.391 ng, 1.58 ng, and 6.25 ng of IgG MAb. −, no antibody added; R, negative control lysate; arrow, the specific shift with OBPH7 protein; vertical bars, the supershifted complexes.
FIG. 7
FIG. 7
Mapping the OBP-2-binding site. (A) Oligonucleotides that span the 50-bp 7–2 oligonucleotide that contains the OBP-2 site were tested for their ability to be directly bound by OBPH7. For each oligonucleotide target, lane 1 contains a binding reaction mixture without any reticulocyte lysate, lane 2 contains reverse negative control lysate, and lane 3 contains lysate with truncated OBPH7 protein. (B) Competition EMSA with unlabeled oligonucleotides at 16- and 80-fold molar excess. −, no competitor was added. NP and R are negative controls as described in the Fig. 5 legend. In panels A and B, arrows point to the specific shifts. (C) Schematic diagram of oligonucleotides used and summary of binding and competition assay results shown in panels A and B. NT, not tested. ++ indicates a stronger degree of interaction of an oligonucleotide with OBPH7 than +; −, no competition observed.
FIG. 8
FIG. 8
Effect of substitutions in the 14-bp core OBP-2 sequence and the resulting OBPH7 consensus recognition sequence. (A) Saturation mutagenesis of the minimal OBPH7 recognition sequence (Table 1, oligonucleotide L0R5). At each position of the 14-bp minimal recognition sequence, oligonucleotides were generated that contained changes to the other three possible base pairs. The label beneath each lane of the gel indicates the position and change made in the competitor used. Sixty-fold molar excesses of unlabeled mutated oligonucleotides were used in competitive EMSA against 32P-labeled 7–2B. The amount of residual shifted radioactivity after competition was quantified by PhosphorImager analysis (Molecular Dynamics). The inhibition of binding of 32P-labeled 7–2B DNA to truncated OBPH7 by each competitor DNA duplex is shown beneath the gel as the percent inhibition relative to the wild-type DNA duplex (WT). The other competitor DNA duplexes shown in panel B were analyzed similarly (data not shown). Positions 10 to 14 were analyzed in the context of the sequence of the longer 7–2Eext oligonucleotide, AATTAGCGTCCACCTCACTCGTAATAGT (WT′), to avoid effects that might be more dependent on proximity to the end of the oligonucleotide than sequence alone. −, no competitor was added. (B) Summary of saturation mutagenesis and the resulting consensus recognition sequence. Open blocks indicate that the given alteration at that position did not result in loss of recognition (competition was at least 70% of WT) and is therefore a permissive change. Hatched and solid blocks indicate that the alteration reduced the binding ability partially or severely, respectively. These designations were based on quantitative trends observed in at least three independent experiments. The asterisk on the N at position 11 indicates that although two of the changes were slightly below the cutoff for recognition, the slight gradient in recognition of all alterations at this position did not enable identification of a clearly preferred sequence. In the consensus sequence, B is a T, G, or C; R is a G or A; Y is a T or C; W is a T or A; and N is any nucleotide.
FIG. 9
FIG. 9
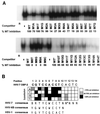
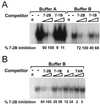
Identification of a second, lower-affinity OBP site (OBP-1) by competitive EMSA. (A) Competition with 16- and 80-fold molar excesses of unlabeled DNA duplexes containing HHV-7 OBP-2 (7–2B) and OBP-1 (7–1B, GGAGGGTTCATTGATCCTCCTTGCCTGCAATTCT) with 32P-labeled 7–2 for binding to OBPH7 in buffers A and B (see Materials and Methods). The amount of residual shifted target was quantitated by PhosphorImager analysis. The percentage of inhibition of binding to 32P-labeled 7–2 DNA relative to 7–2B at 80-fold molar excesses by each competitor DNA duplex is shown beneath the gel. −, no competitor present; R, negative control lysate. (B) Conditions are the same as described for panel A, except that binding buffer B was used. Oligonucleotide 6 contains the OBP-1 site and is described in the legend to Fig. 4. TAR is described in the legend for Fig. 5.
FIG. 10
FIG. 10
EMSA to measure recognition of heteroduplexes. (A) Heteroduplex oligonucleotides containing single mismatched base pairs at positions 2 through 9 were created by annealing a wild-type 7–2Eext oligonucleotide to complementary oligonucleotides containing single nucleotide substitutions. For positions 2 through 9, 60-fold molar excesses of heteroduplex oligonucleotides with a mutation on the 5′-to-3′ sense strand (s) or a mutation of the 3′-to-5′ complementary strand (c) were compared for their ability to compete for binding with truncated OBPH7 against oligonucleotides containing the mutation on both strands (b). −, no competitor; WT, wild-type 7–2E is the competitor; R, negative control protein lysate. (B) Helical wheel representation of heteroduplex analysis. The 9-bp OBP-2 core sequence is arranged on a helical wheel to approximate the 10.4 base residues per turn of a B-form DNA helix. For each position, two heteroduplex oligonucleotides were synthesized with changes on the sense strand (first set of parentheses) and two were made with changes on the complementary strand (second set of parentheses). Purine-to-purine and pyrimidine-to-pyrimidine changes are indicated by triangles. Purine-to-pyrimidine and pyrimidine-to-purine changes are indicated as circles. Solid symbols indicate that strand-specific alteration is responsible for loss of recognition at that position in the core sequence. Asterisks indicate the side of the DNA helix that is critical for recognition; thus, a change on the complementary strand that affects recognition is indicated by an asterisk on the opposite side of the helix (e.g., the T at position 6). (C) A B-form DNA model of the OBP-2 site, CGTCCACCTCA, was produced using Insight II, Release 2000 (Molecular Simulations, Incorporated, San Diego, Calif.). Labeled positions indicate strand mismatches that resulted in the loss of recognition by OBPH7.
FIG. 10
FIG. 10
EMSA to measure recognition of heteroduplexes. (A) Heteroduplex oligonucleotides containing single mismatched base pairs at positions 2 through 9 were created by annealing a wild-type 7–2Eext oligonucleotide to complementary oligonucleotides containing single nucleotide substitutions. For positions 2 through 9, 60-fold molar excesses of heteroduplex oligonucleotides with a mutation on the 5′-to-3′ sense strand (s) or a mutation of the 3′-to-5′ complementary strand (c) were compared for their ability to compete for binding with truncated OBPH7 against oligonucleotides containing the mutation on both strands (b). −, no competitor; WT, wild-type 7–2E is the competitor; R, negative control protein lysate. (B) Helical wheel representation of heteroduplex analysis. The 9-bp OBP-2 core sequence is arranged on a helical wheel to approximate the 10.4 base residues per turn of a B-form DNA helix. For each position, two heteroduplex oligonucleotides were synthesized with changes on the sense strand (first set of parentheses) and two were made with changes on the complementary strand (second set of parentheses). Purine-to-purine and pyrimidine-to-pyrimidine changes are indicated by triangles. Purine-to-pyrimidine and pyrimidine-to-purine changes are indicated as circles. Solid symbols indicate that strand-specific alteration is responsible for loss of recognition at that position in the core sequence. Asterisks indicate the side of the DNA helix that is critical for recognition; thus, a change on the complementary strand that affects recognition is indicated by an asterisk on the opposite side of the helix (e.g., the T at position 6). (C) A B-form DNA model of the OBP-2 site, CGTCCACCTCA, was produced using Insight II, Release 2000 (Molecular Simulations, Incorporated, San Diego, Calif.). Labeled positions indicate strand mismatches that resulted in the loss of recognition by OBPH7.
FIG. 11
FIG. 11
Comparison of the OBP sites in the ori regions of alphaherpesviruses and roseoloviruses. OBP-binding regions of the oriLyts of alphaherpesviruses and roseoloviruses are shown. HSV1 L, HSV-1 oriL; HSV1 S, HSV-1 oriS; HSV2 L, HSV-2 oriL; HSV2 S, HSV-2 oriS; EHV1 S, equine herpesvirus 1 oriS; PRV, pseudorabies virus; VZV, varicella-zoster virus; MDV2, Marek's disease virus 2; I, II, and III, Box I, II, and III of HSV-1 oriS. Residues that match the HHV-7 consensus are shaded. Horizontal arrows indicate a structure with dyad symmetry in the HHV-7 sequence. The HHV-7 Box III-like sequence is underlined.

Similar articles

Cited by

References

    1. Anders D G, Kacica M A, Pari G, Punturieri S M. Boundaries and structure of human cytomegalovirus oriLyt, a complex origin for lytic-phase DNA replication. J Virol. 1992;66:3373–3384. - PMC - PubMed
    1. Anders D G, Punturieri S M. Multicomponent origin of cytomegalovirus lytic-phase DNA replication. J Virol. 1991;65:931–937. - PMC - PubMed
    1. Aslani A, Simonsson S, Elias P. A novel conformation of the herpes simplex virus origin of DNA replication recognized by the origin binding protein. J Biol Chem. 2000;275:5880–5887. - PubMed
    1. Black J B, Burns D A, Goldsmith C S, Feorino P M, Kite-Powell K, Schinazi R F, Krug P W, Pellett P E. Biologic properties of human herpesvirus 7 strain SB. Virus Res. 1997;52:25–41. - PubMed
    1. Black J B, Pellett P E. Human herpesvirus 7. Rev Med Virol. 1999;9:245–262. - PubMed

Publication types

MeSH terms