

Review
doi: 10.1186/bcr274.
Epub 2000 Dec 18.
Molecular profiling of breast cancer: portraits but not physiognomy
Affiliations
- PMID: 11250749
- PMCID: PMC138674
- DOI: 10.1186/bcr274
Item in Clipboard
Review
Molecular profiling of breast cancer: portraits but not physiognomy
Breast Cancer Res.
2001.
Abstract
Breast cancers differ in response to treatment and may have a divergent clinical course despite having a similar histopathological appearance. New technology using DNA microarrays provides a systematic method to identify key markers for prognosis and treatment response by profiling thousands of genes expressed in a single cancer. Microarray profiling of 38 invasive breast cancers now confirms striking molecular differences between ductal carcinoma specimens and suggests a new classification for oestrogen-receptor negative breast cancer. Future approaches will need to include methods for high-throughput clinical validation and the ability to analyze microscopic samples.
Figures
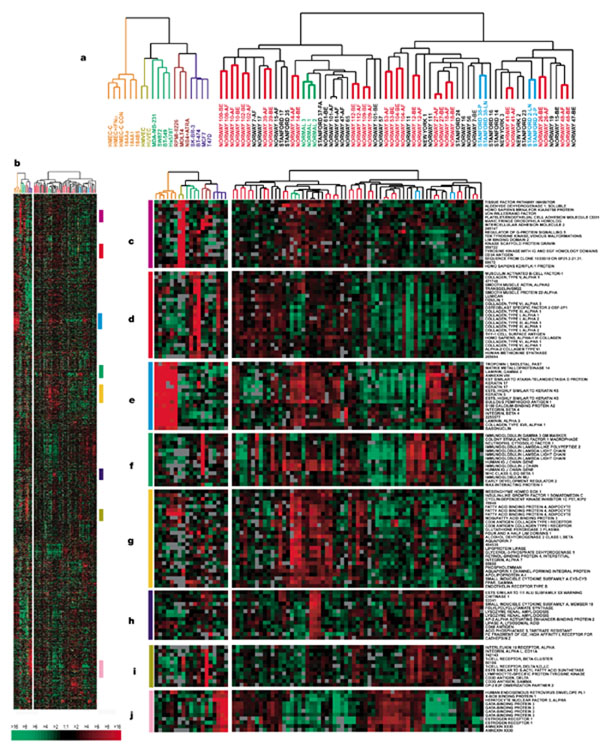
Variation in expression of 1753 genes in 84 experimental samples. Data are presented in a matrix format: each row represents a single gene, and each column an experimental sample. In each sample, the ratio of the abundance of transcripts of each gene to the median abundance of the gene's transcript among all the cell lines (left panel), or to its median abundance across all tissue samples (right panel), is represented by the colour of the corresponding cell in the matrix. Green squares, transcript levels below the median; black squares, transcript levels equal to the median; red squares, transcript levels greater than the median; grey squares, technically inadequate or missing data. Colour saturation reflects the magnitude of the ratio relative to the median for each set of samples (see scale, bottom left). (a) Dendrogram representing similarities in the expression patterns between experimental samples. All 'before and after' chemotherapy pairs that were clustered on terminal branches are highlighted in red; the two primary tumour/lymph node metastasis pairs in light blue; the three clustered normal normal breast samples in light green. Branches representing the four breast luminal epithelial cell lines are shown in dark blue; breast basal epithelial cell lines in orange, the endothelial cell lines in dark yellow, the mesenchymal-like cell lines in dark green, and the lymphocyte-derived cell lines in brown. (b) Scaled-down representation of the 1753-gene cluster diagram; coloured bars to the right identify the locations of the inserts displayed in c-j. (c) Endothelial cell gene expression cluster; (d) stromal/fibroblast cluster; (e) breast basal epithelial cluster; (f) B-cell cluster; (g) adipose-enriched/normal breast; (h) macrophage; (i) T-cell; (j) breast luminal epithelial cell. The Figure and legend are reproduced here, with permission, from [2]. The "supplementary information Figure 4" referred to above is also part of [2], and can be accessed there. The colour mentioned in the legend can be viewed online at http://breast-cancer-research.com/3/2
Similar articles
-
Profiling familial breast cancer.Nat Med. 2001 Apr;7(4):408-10. doi: 10.1038/86464. Nat Med. 2001. PMID: 11283660 No abstract available.
-
Influence of BRCA1 mutations on nuclear grade and estrogen receptor status of breast carcinoma in Ashkenazi Jewish women.Cancer. 1997 Aug 1;80(3):435-41. doi: 10.1002/(sici)1097-0142(19970801)80:3<435::aid-cncr11>3.0.co;2-y. Cancer. 1997. PMID: 9241077
-
RERG (Ras-like, oestrogen-regulated, growth-inhibitor) expression in breast cancer: a marker of ER-positive luminal-like subtype.Breast Cancer Res Treat. 2011 Jul;128(2):315-26. doi: 10.1007/s10549-010-1073-y. Epub 2010 Aug 10. Breast Cancer Res Treat. 2011. PMID: 20697807
-
Gene expression profiling of breast cancer.Annu Rev Pathol. 2008;3:67-97. doi: 10.1146/annurev.pathmechdis.3.121806.151505. Annu Rev Pathol. 2008. PMID: 18039137 Review.
-
Applications of microarray technology in breast cancer research.Breast Cancer Res. 2001;3(3):158-75. doi: 10.1186/bcr291. Epub 2001 Mar 20. Breast Cancer Res. 2001. PMID: 11305951 Free PMC article. Review.
Cited by
-
Microarray gene expression profiling and analysis in renal cell carcinoma.BMC Urol. 2004 Jun 22;4:9. doi: 10.1186/1471-2490-4-9. BMC Urol. 2004. PMID: 15212686 Free PMC article.
-
Embryonic reversions and lineage infidelities in tumour cells: genome-based models and role of genetic instability.Int J Exp Pathol. 2005 Apr;86(2):67-79. doi: 10.1111/j.0959-9673.2005.00421.x. Int J Exp Pathol. 2005. PMID: 15810978 Free PMC article. Review.
-
Knockdown of TFIIS by RNA silencing inhibits cancer cell proliferation and induces apoptosis.BMC Cancer. 2008 May 12;8:133. doi: 10.1186/1471-2407-8-133. BMC Cancer. 2008. PMID: 18474089 Free PMC article.
-
DNA microarrays with stem-loop DNA probes: preparation and applications.Nucleic Acids Res. 2001 Oct 1;29(19):E92. doi: 10.1093/nar/29.19.e92. Nucleic Acids Res. 2001. PMID: 11574694 Free PMC article.
-
Analysis of multiple sarcoma expression datasets: implications for classification, oncogenic pathway activation and chemotherapy resistance.PLoS One. 2010 Apr 1;5(4):e9747. doi: 10.1371/journal.pone.0009747. PLoS One. 2010. PMID: 20368975 Free PMC article.
References
-
- Perou CM, Sorlie T, Eisen MB, van de Rijn M, Jeffrey SS, Rees CA, Pollack JR, Ross DT, Johnsen H, Akslen LA, Fluge O, Pergamenschikov A, Williams C, Zhu SX, Lonning PE, Borresen-Dale AL, Brown PO, Botstein D. Molecular portraits of human breast tumours. Nature. 2000;406:747–752. doi: 10.1038/35021093. - DOI - PubMed
-
- Alizadeh AA, Eisen MB, Davis RE, Ma C, Lossos IS, Rosenwald A, Boldrick JC, Sabet H, Tran T, Yu X, Powell JI, Yang L, Marti GE, Moore T, Hudson J, Jr, Lu L, Lewis DB, Tibshirani R, Sherlock G, Chan WC, Greiner TC, Weisenburger DD, Armitage JO, Warnke R, Staudt LM. Distinct types of diffuse large B-cell lymphoma identified by gene expression profiling. Nature. 2000;403:503–511. doi: 10.1038/35000501. - DOI - PubMed
-
- Bittner M, Meltzer P, Chen Y, Jiang Y, Seftor E, Hendrix M, Radmacher M, Simon R, Yakhini Z, Ben-Dor A, Sampas N, Dougherty E, Wang E, Marincola F, Gooden C, Lueders J, Glatfelter A, Pollock P, Carpten J, Gillanders E, Leja D, Dietrich K, Beaudry C, Berens M, Alberts D, Sondak V. Molecular classification of cutaneous malignant melanoma by gene expression profiling. Nature. 2000;406:536–540. doi: 10.1038/35020115. - DOI - PubMed
Publication types
MeSH terms
Substances
LinkOut - more resources
Full Text Sources
Other Literature Sources
Medical
