Essential role of STAT3 in the control of the acute-phase response as revealed by inducible gene inactivation [correction of activation] in the liver
- PMID: 11238899
- PMCID: PMC86708
- DOI: 10.1128/MCB.21.5.1621-1632.2001
Essential role of STAT3 in the control of the acute-phase response as revealed by inducible gene inactivation [correction of activation] in the liver
Erratum in
- Mol Cell Biol 2001 Apr;21(8):2967
Abstract
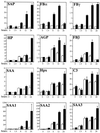
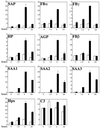
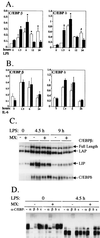
We generated mice carrying a STAT3 allele amenable to Cre-mediated deletion and intercrossed them with Mx-Cre transgenic mice, in which the expression of Cre recombinase can be induced by type I interferon. Interferon-induced deletion of STAT3 occurred very efficiently (more than 90%) in the liver and slightly less efficiently (about 70%) in the bone marrow. Analysis of the induction of liver acute-phase genes in response to bacterial lipopolysaccharide unequivocally identifies STAT3 as a fundamental mediator of their induction. The different degrees of defectiveness displayed by the various genes allowed us to differentiate them into three separate groups according to their degree of dependence on STAT3. Induction was totally defective for group I genes, defective at 24 h but almost normal at earlier time points for group II genes, and only slightly defective for group III genes. This division was in good agreement with the known structures of the respective promoters. We also found that the overall induction of the transcription factors C/EBP beta and -delta was only minimally defective in the absence of STAT3. Finally, even though corticosterone levels and action were found to be normal in the conditional-mutant mice, production of both proinflammatory and antiinflammatory cytokines was increased and prolonged, probably as a result of STAT3 deletion in macrophages.
Figures


Similar articles
-
CCAAT/Enhancer binding protein delta (c/EBPdelta) regulation and expression in human mammary epithelial cells: II. Analysis of activating signal transduction pathways, transcriptional, post-transcriptional, and post-translational control.J Cell Biochem. 2004 Nov 1;93(4):844-56. doi: 10.1002/jcb.20224. J Cell Biochem. 2004. PMID: 15389878
-
CCAAT/enhancer-binding protein delta gene expression is mediated by APRF/STAT3.J Biochem. 1997 Apr;121(4):731-8. doi: 10.1093/oxfordjournals.jbchem.a021647. J Biochem. 1997. PMID: 9163525
-
Gene expression of CCAAT/enhancer-binding protein delta mediated by autoregulation is repressed by related gene family proteins.Biol Pharm Bull. 2000 Dec;23(12):1424-9. doi: 10.1248/bpb.23.1424. Biol Pharm Bull. 2000. PMID: 11145170
-
The role of Stat3 in apoptosis and mammary gland involution. Conditional deletion of Stat3.Adv Exp Med Biol. 2000;480:129-38. doi: 10.1007/0-306-46832-8_16. Adv Exp Med Biol. 2000. PMID: 10959419 Review.
-
A novel role for STAT3 in cardiac remodeling.Trends Cardiovasc Med. 2000 Oct;10(7):298-303. doi: 10.1016/s1050-1738(01)00066-4. Trends Cardiovasc Med. 2000. PMID: 11343970 Review.
Cited by
-
IL-6 promotes MYC-induced B cell lymphomagenesis independent of STAT3.PLoS One. 2021 Mar 2;16(3):e0247394. doi: 10.1371/journal.pone.0247394. eCollection 2021. PLoS One. 2021. PMID: 33651821 Free PMC article.
-
STAT3 regulated ARF expression suppresses prostate cancer metastasis.Nat Commun. 2015 Jul 22;6:7736. doi: 10.1038/ncomms8736. Nat Commun. 2015. PMID: 26198641 Free PMC article.
-
Lipocalin 2 deactivates macrophages and worsens pneumococcal pneumonia outcomes.J Clin Invest. 2013 Aug;123(8):3363-72. doi: 10.1172/JCI67911. Epub 2013 Jul 1. J Clin Invest. 2013. PMID: 23863624 Free PMC article.
-
Multifaceted roles for STAT3 in gammaherpesvirus latency revealed through in vivo B cell knockout models.mBio. 2024 Feb 14;15(2):e0299823. doi: 10.1128/mbio.02998-23. Epub 2024 Jan 3. mBio. 2024. PMID: 38170993 Free PMC article.
-
Gene expression profiling of mammary gland development reveals putative roles for death receptors and immune mediators in post-lactational regression.Breast Cancer Res. 2004;6(2):R92-109. doi: 10.1186/bcr754. Epub 2003 Dec 18. Breast Cancer Res. 2004. PMID: 14979921 Free PMC article.
References
-
- Akira S. Roles of STAT3 defined by tissue-specific gene targeting. Oncogene. 2000;19:2607–2611. - PubMed
-
- Alonzi T, Fattori E, Cappelletti M, Ciliberto G, Poli V. Impaired stat3 activation following localized inflammatory stimulus in IL-6-deficient mice. Cytokine. 1998;10:13–18. - PubMed
-
- Baumann H, Richards C, Gauldie J. Interaction among hepatocyte-stimulating factors, interleukin 1, and glucocorticoids for regulation of acute phase plasma proteins in human hepatoma (HepG2) cells. J Immunol. 1987;139:4122–4128. - PubMed
-
- Besedovsky H, del Rey A, Sorkin E, Dinarello C A. Immunoregulatory feedback between interleukin-1 and glucocorticoid hormones. Science. 1986;233:652–654. - PubMed
-
- Betts J C, Cheshire J K, Akira S, Kishimoto T, Woo P. The role of NF-κB and NF-IL6 transactivating factors in the synergistic activation of human serum amyloid A gene expression by interleukin-1 and interleukin-6. J Biol Chem. 1993;268:25624–25631. - PubMed
Publication types
MeSH terms
Substances
LinkOut - more resources
Full Text Sources
Molecular Biology Databases
Miscellaneous
