

Dependence of lymphopenia-induced T cell proliferation on the abundance of peptide/ MHC epitopes and strength of their interaction with T cell receptors
- PMID: 11172019
- PMCID: PMC29325
- DOI: 10.1073/pnas.98.4.1728
Dependence of lymphopenia-induced T cell proliferation on the abundance of peptide/ MHC epitopes and strength of their interaction with T cell receptors
Abstract
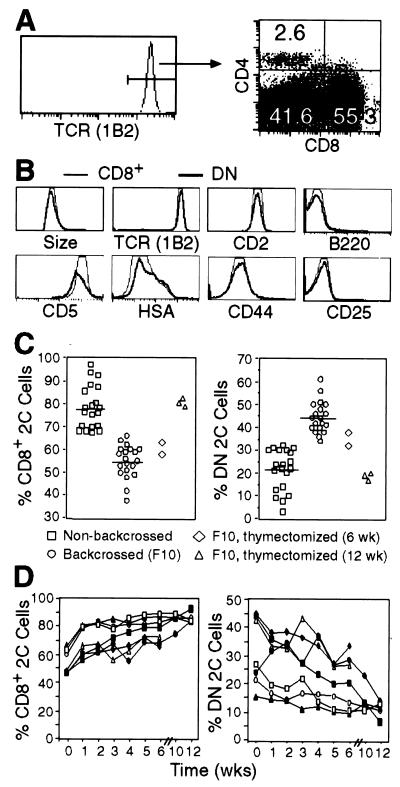
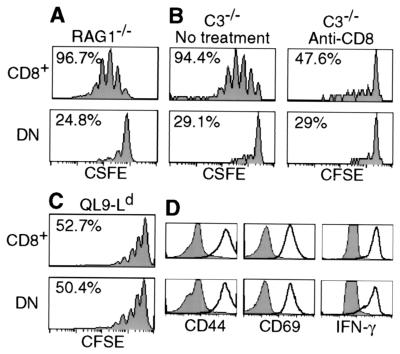
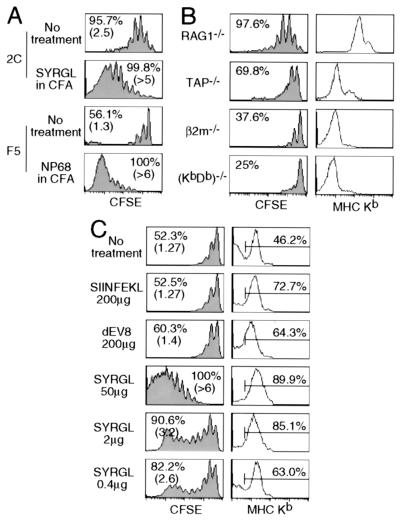
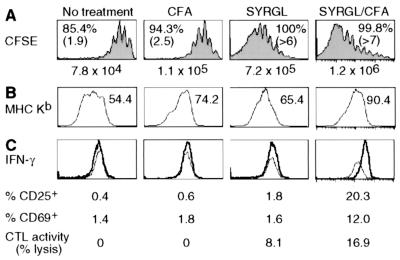
Factors that affect naive T cell proliferation in syngeneic lymphopenic hosts were investigated. 2C T cell receptor (TCR) transgenic T cells lacking both CD8 and CD4 survived but hardly proliferated. Proliferation of CD8(+) 2C cells was proportional to the abundance of cognate peptide/MHC complexes and was severely inhibited by injection of anti-CD8 antibody. Weakly reactive self-peptides slightly enhanced CD8(+) 2C cell proliferation whereas a potent agonist peptide promoted much more rapid proliferation, but inflammation-stimulating adjuvant had only a small effect on the rate of cell proliferation. The findings suggest that under uniform lymphopenic conditions, the widely different rates of proliferation of T cells expressing various TCR, or the same TCR in the presence or absence of CD8, reflect the strength of interaction between TCR and MHC associated with particular self-peptides.
Figures
Similar articles
-
Differences in antigen recognition and cytolytic activity of CD8(+) and CD8(-) T cells that express the same antigen-specific receptor.Proc Natl Acad Sci U S A. 2001 Feb 13;98(4):1723-7. doi: 10.1073/pnas.98.4.1723. Proc Natl Acad Sci U S A. 2001. PMID: 11172018 Free PMC article.
-
Survival and homeostatic proliferation of naive peripheral CD4+ T cells in the absence of self peptide:MHC complexes.J Immunol. 2000 Sep 1;165(5):2458-64. doi: 10.4049/jimmunol.165.5.2458. J Immunol. 2000. PMID: 10946271
-
Competition for self-peptide-MHC complexes and cytokines between naive and memory CD8+ T cells expressing the same or different T cell receptors.Proc Natl Acad Sci U S A. 2004 Mar 2;101(9):3041-6. doi: 10.1073/pnas.0307339101. Epub 2004 Feb 19. Proc Natl Acad Sci U S A. 2004. PMID: 14976256 Free PMC article.
-
Probing the activation requirements for naive CD8+ T cells with Drosophila cell transfectants as antigen presenting cells.Immunol Rev. 1998 Oct;165:249-65. doi: 10.1111/j.1600-065x.1998.tb01243.x. Immunol Rev. 1998. PMID: 9850865 Review.
-
MHC-peptide tetramers to visualize antigen-specific T cells.Curr Protoc Immunol. 2003 May;Chapter 17:17.3.1-17.3.33. doi: 10.1002/0471142735.im1703s53. Curr Protoc Immunol. 2003. PMID: 18432902 Review.
Cited by
-
Blockade of programmed death ligand 1 enhances the therapeutic efficacy of combination immunotherapy against melanoma.J Immunol. 2010 Apr 1;184(7):3442-9. doi: 10.4049/jimmunol.0904114. Epub 2010 Mar 1. J Immunol. 2010. PMID: 20194714 Free PMC article.
-
Differences in antigen recognition and cytolytic activity of CD8(+) and CD8(-) T cells that express the same antigen-specific receptor.Proc Natl Acad Sci U S A. 2001 Feb 13;98(4):1723-7. doi: 10.1073/pnas.98.4.1723. Proc Natl Acad Sci U S A. 2001. PMID: 11172018 Free PMC article.
-
Immune Equilibrium Depends on the Interaction Between Recognition and Presentation Landscapes.Front Immunol. 2021 Jul 30;12:706136. doi: 10.3389/fimmu.2021.706136. eCollection 2021. Front Immunol. 2021. PMID: 34394106 Free PMC article. Review.
-
Impact of PEG sensitization on the efficacy of PEG hydrogel-mediated tissue engineering.Nat Commun. 2024 Apr 18;15(1):3283. doi: 10.1038/s41467-024-46327-3. Nat Commun. 2024. PMID: 38637507 Free PMC article.
-
Control of homeostatic proliferation by regulatory T cells.J Clin Invest. 2005 Dec;115(12):3517-26. doi: 10.1172/JCI25463. Epub 2005 Nov 17. J Clin Invest. 2005. PMID: 16294223 Free PMC article.
References
-
- Goldrath A W, Bevan M J. Nature (London) 1999;402:255–261. - PubMed
-
- Marrack P, Bender J, Hildeman D, Jordan M, Mitchell T, Murakami M, Sakamoto A, Schaefer B C, Swanson B, Kappler J. Nat Immunol. 2000;1:107–111. - PubMed
-
- Bruno L, Kirberg J, von Boehmer H. Immunity. 1995;2:37–43. - PubMed
-
- Tanchot C, Lemonnier F A, Pérarnau B, Freitas A A, Rocha B. Science. 1997;276:2057–2062. - PubMed
Publication types
MeSH terms
Substances
Grants and funding
LinkOut - more resources
Full Text Sources
Other Literature Sources
Research Materials
