Eight novel families of miniature inverted repeat transposable elements in the African malaria mosquito, Anopheles gambiae
- PMID: 11172014
- PMCID: PMC29320
- DOI: 10.1073/pnas.98.4.1699
Eight novel families of miniature inverted repeat transposable elements in the African malaria mosquito, Anopheles gambiae
Abstract
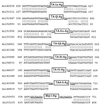
Eight novel families of miniature inverted repeat transposable elements (MITEs) were discovered in the African malaria mosquito, Anopheles gambiae, by using new software designed to rapidly identify MITE-like sequences based on their structural characteristics. Divergent subfamilies have been found in two families. Past mobility was demonstrated by evidence of MITE insertions that resulted in the duplication of specific TA, TAA, or 8-bp targets. Some of these MITEs share the same target duplications and similar terminal sequences with MITEs and other DNA transposons in human and other organisms. MITEs in A. gambiae range from 40 to 1340 copies per genome, much less abundant than MITEs in the yellow fever mosquito, Aedes aegypti. Statistical analyses suggest that most A. gambiae MITEs are in highly AT-rich regions, many of which are closely associated with each other. The analyses of these novel MITEs underscored interesting questions regarding their diversity, origin, evolution, and relationships to the host genomes. The discovery of diverse families of MITEs in A. gambiae has important practical implications in light of current efforts to control malaria by replacing vector mosquitoes with genetically modified refractory mosquitoes. Finally, the systematic approach to rapidly identify novel MITEs should have broad applications for the analysis of the ever-growing sequence databases of a wide range of organisms.
Figures


Similar articles
-
Molecular and evolutionary analysis of two divergent subfamilies of a novel miniature inverted repeat transposable element in the yellow fever mosquito, Aedes aegypti.Mol Biol Evol. 2000 Sep;17(9):1313-25. doi: 10.1093/oxfordjournals.molbev.a026415. Mol Biol Evol. 2000. PMID: 10958848
-
Ikirara, a novel transposon family from the malaria vector mosquito, Anopheles gambiae.Insect Mol Biol. 1998 Feb;7(1):1-10. doi: 10.1046/j.1365-2583.1998.71046.x. Insect Mol Biol. 1998. PMID: 9459424
-
P elements and MITE relatives in the whole genome sequence of Anopheles gambiae.BMC Genomics. 2006 Aug 18;7:214. doi: 10.1186/1471-2164-7-214. BMC Genomics. 2006. PMID: 16919158 Free PMC article.
-
Mosquito transposable elements.Insect Biochem Mol Biol. 2004 Jul;34(7):631-44. doi: 10.1016/j.ibmb.2004.03.016. Insect Biochem Mol Biol. 2004. PMID: 15242704 Review.
-
[Active miniature inverted-repeat transposable elements transposon in plants: a review].Sheng Wu Gong Cheng Xue Bao. 2018 Feb 25;34(2):204-215. doi: 10.13345/j.cjb.170206. Sheng Wu Gong Cheng Xue Bao. 2018. PMID: 29424134 Review. Chinese.
Cited by
-
Miniature Inverted-Repeat Transposable Elements (MITEs) in the Two Lepidopteran Genomes of Helicoverpa armigera and Helicoverpa zea.Insects. 2022 Mar 23;13(4):313. doi: 10.3390/insects13040313. Insects. 2022. PMID: 35447755 Free PMC article.
-
Transposition of a fungal miniature inverted-repeat transposable element through the action of a Tc1-like transposase.Genetics. 2007 Jan;175(1):441-52. doi: 10.1534/genetics.106.064360. Epub 2006 Dec 18. Genetics. 2007. PMID: 17179071 Free PMC article.
-
Repetitive DNA sequence detection and its role in the human genome.Commun Biol. 2023 Sep 19;6(1):954. doi: 10.1038/s42003-023-05322-y. Commun Biol. 2023. PMID: 37726397 Free PMC article. Review.
-
Fertility restorer locus Rf1 [corrected] of sorghum (Sorghum bicolor L.) encodes a pentatricopeptide repeat protein not present in the colinear region of rice chromosome 12.Theor Appl Genet. 2005 Oct;111(6):994-1012. doi: 10.1007/s00122-005-2011-y. Epub 2005 Aug 3. Theor Appl Genet. 2005. PMID: 16078015
-
Characterization of a group of MITEs with unusual features from two coral genomes.PLoS One. 2010 May 18;5(5):e10700. doi: 10.1371/journal.pone.0010700. PLoS One. 2010. PMID: 20502527 Free PMC article.
References
Publication types
MeSH terms
Substances
Grants and funding
LinkOut - more resources
Full Text Sources
Miscellaneous

