Fate of Mycobacterium tuberculosis within murine dendritic cells
- PMID: 11159971
- PMCID: PMC97955
- DOI: 10.1128/IAI.69.2.800-809.2001
Fate of Mycobacterium tuberculosis within murine dendritic cells
Abstract
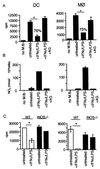
The interaction of microbes with dendritic cells (DCs) is likely to have an enormous impact on the initiation of the immune response against a pathogen. In this study, we compared the interaction of Mycobacterium tuberculosis with murine bone marrow-derived DCs and macrophages (M phi) in vitro. M. tuberculosis grew equally well within nonactivated DCs and M phi. Activation of DCs and M phi with gamma interferon and lipopolysaccharide inhibited the growth of the intracellular bacteria in a nitric oxide synthase-dependent fashion. However, while this activation enabled M phi to kill the intracellular bacteria, the M. tuberculosis bacilli within activated DCs were not killed. Thus, DCs could restrict the growth of the intracellular mycobacteria but were less efficient than M phi at eliminating the infection. These results may have implications for priming immune responses to M. tuberculosis. In addition, they suggest that DCs may serve as a reservoir for M. tuberculosis in tissues, including the lymph nodes and lungs.
Figures


Similar articles
-
Differential Effects of Mycobacterium bovis BCG on Macrophages and Dendritic Cells from Murine Spleen.Int J Mol Sci. 2015 Oct 13;16(10):24127-38. doi: 10.3390/ijms161024127. Int J Mol Sci. 2015. PMID: 26473844 Free PMC article.
-
Pulmonary mucosal dendritic cells in T-cell activation: implications for TB therapy.Expert Rev Respir Med. 2011 Feb;5(1):75-85. doi: 10.1586/ers.10.81. Expert Rev Respir Med. 2011. PMID: 21348588
-
Partial and ineffective activation of V gamma 9V delta 2 T cells by Mycobacterium tuberculosis-infected dendritic cells.J Immunol. 2010 Aug 1;185(3):1770-6. doi: 10.4049/jimmunol.1000966. Epub 2010 Jun 30. J Immunol. 2010. PMID: 20592281
-
Mycobacterium tuberculosis and dendritic cells: recognition, activation and functional implications.Indian J Biochem Biophys. 2007 Oct;44(5):279-88. Indian J Biochem Biophys. 2007. PMID: 18341202 Review.
-
The role of dendritic cells in Mycobacterium tuberculosis infection.Virulence. 2012 Nov 15;3(7):654-9. doi: 10.4161/viru.22586. Epub 2012 Nov 15. Virulence. 2012. PMID: 23154283 Free PMC article. Review.
Cited by
-
Respiratory dendritic cells: mediators of tolerance and immunity.Immunol Res. 2007;39(1-3):128-45. doi: 10.1007/s12026-007-0077-0. Immunol Res. 2007. PMID: 17917061 Review.
-
The inducible nitric oxide synthase locus confers protection against aerogenic challenge of both clinical and laboratory strains of Mycobacterium tuberculosis in mice.Infect Immun. 2001 Dec;69(12):7711-7. doi: 10.1128/IAI.69.12.7711-7717.2001. Infect Immun. 2001. PMID: 11705952 Free PMC article.
-
Mycobacterium tuberculosis PE25/PPE41 protein complex induces activation and maturation of dendritic cells and drives Th2-biased immune responses.Med Microbiol Immunol. 2016 Apr;205(2):119-31. doi: 10.1007/s00430-015-0434-x. Epub 2015 Aug 30. Med Microbiol Immunol. 2016. PMID: 26318856
-
Association of ESAT-6/CFP-10-induced IFN-γ, TNF-α and IL-10 with clinical tuberculosis: evidence from cohorts of pulmonary tuberculosis patients, household contacts and community controls in an endemic setting.Clin Exp Immunol. 2017 Aug;189(2):241-249. doi: 10.1111/cei.12972. Epub 2017 May 2. Clin Exp Immunol. 2017. PMID: 28374535 Free PMC article.
-
Mycobacterium tuberculosis infection of dendritic cells leads to partially caspase-1/11-independent IL-1β and IL-18 secretion but not to pyroptosis.PLoS One. 2012;7(7):e40722. doi: 10.1371/journal.pone.0040722. Epub 2012 Jul 24. PLoS One. 2012. PMID: 22911706 Free PMC article.
References
-
- Ahuja S S, Mummidi S, Malech H L, Ahuja S K. Human dendritic cell (DC)-based anti-infective therapy: engineering DCs to secrete functional IFN-gamma and IL-12. J Immunol. 1998;161:868–876. - PubMed
-
- Banchereau J, Steinman R M. Dendritic cells and the control of immunity. Nature. 1998;392:245–252. - PubMed
-
- Barnes P F, Modlin R L, Ellner J J. T-cell responses and cytokines. In: Bloom B R, editor. Tuberculosis: pathogenesis, protection, and control. Washington, D.C.: American Society for Microbiology; 1994. p. 417.
-
- Bonham C A, Lu L, Hoffman R A, Simmons R L, Thomson A W. Generation of nitric oxide by mouse dendritic cells and its implications for immune response regulation. Adv Exp Med Biol. 1997;417:283–290. - PubMed
Publication types
MeSH terms
Substances
Grants and funding
LinkOut - more resources
Full Text Sources

