. 2001 Jan 15;15(2):213-25.
doi: 10.1101/gad.851501.

The retinoic acid-inactivating enzyme CYP26 is essential for establishing an uneven distribution of retinoic acid along the anterio-posterior axis within the mouse embryo

Affiliations

The retinoic acid-inactivating enzyme CYP26 is essential for establishing an uneven distribution of retinoic acid along the anterio-posterior axis within the mouse embryo

Y Sakai et al. Genes Dev. .

Abstract

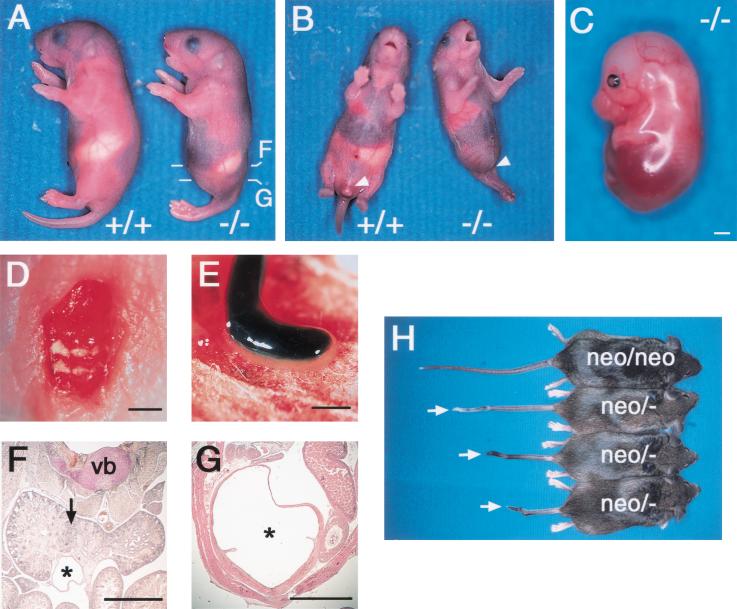
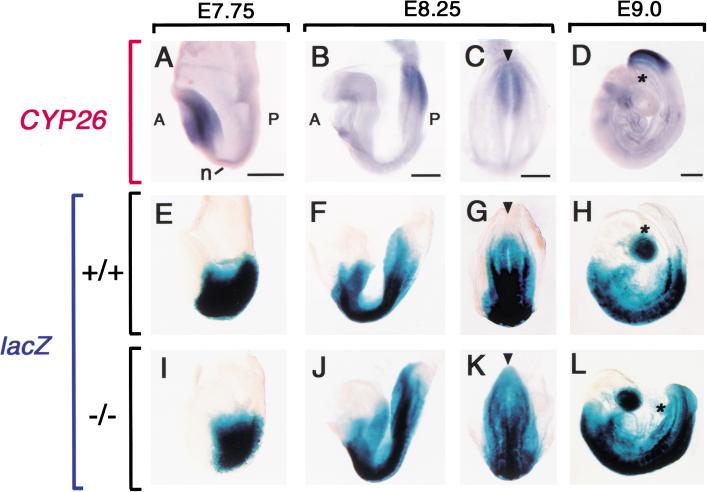
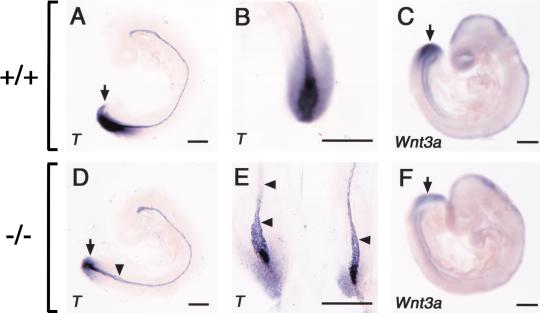
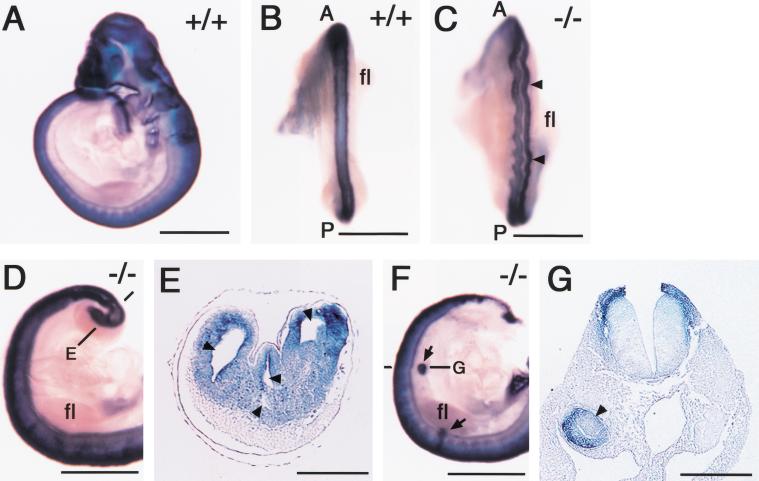
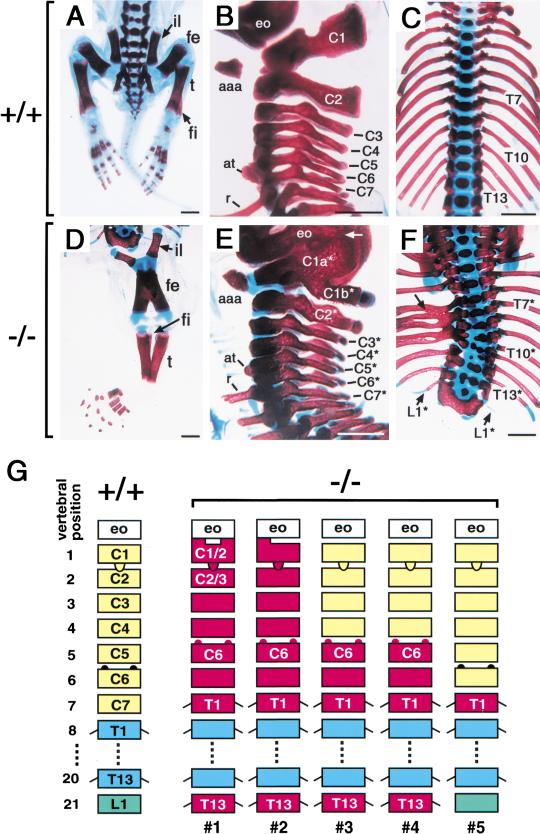
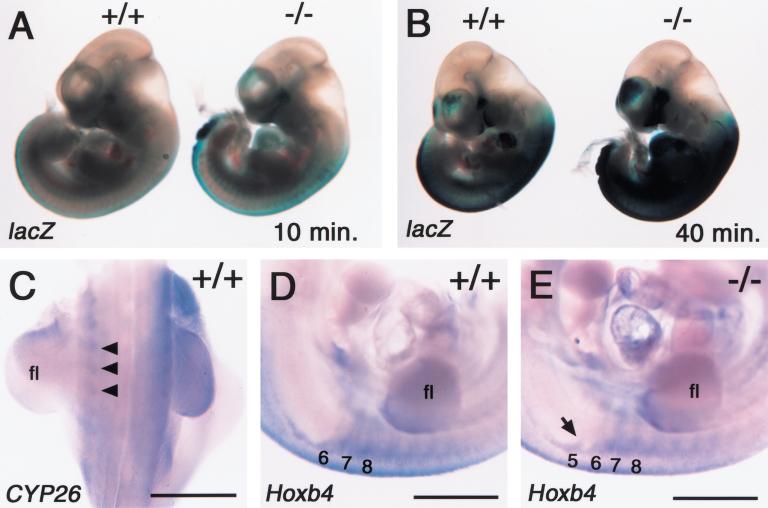
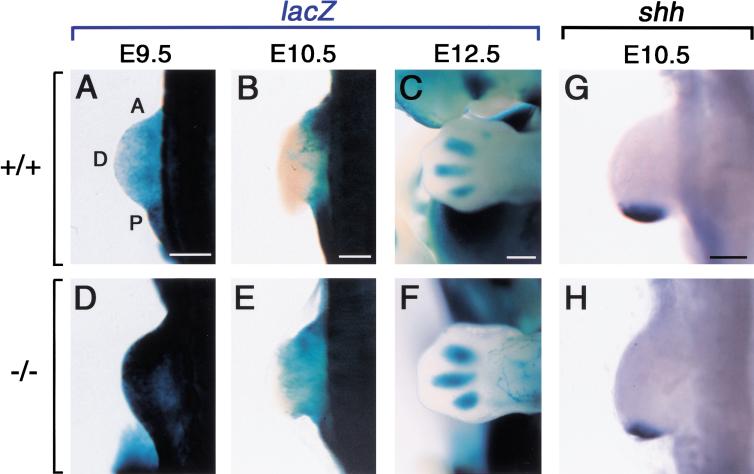
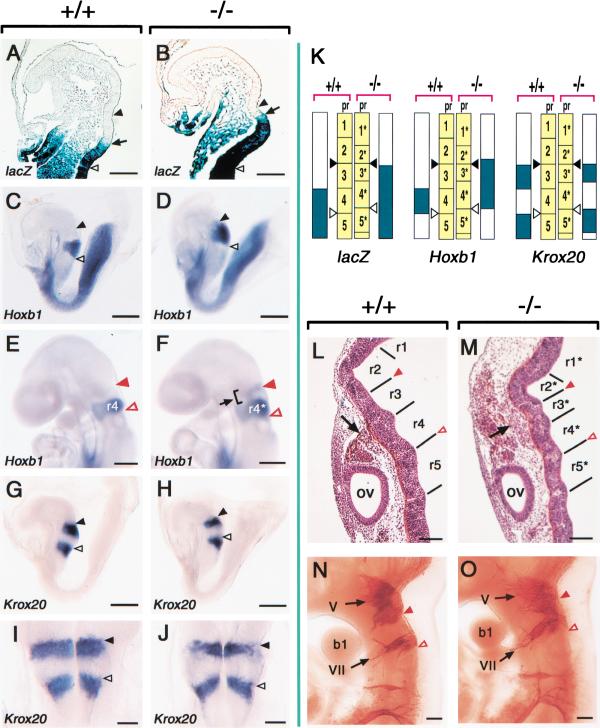
Retinoic acid (RA), a derivative of vitamin A, plays a pivotal role in vertebrate development. The level of RA may be determined by the balance between its synthesis and degradation. We have examined the role of CYP26, a P450 enzyme that may degrade RA, by generating mutant mice that lack CYP26. CYP26(-/-) mice exhibited anomalies, including caudal agenesis, similar to those induced by administration of excess RA. The concentration of endogenous RA, as revealed by marker gene activity, was markedly increased in the tailbud of the mutant animals, in which CYP26 is normally expressed. Expression of T (Brachyury) and Wnt3a in the tailbud was down-regulated in CYP26(-/-) mice, which may underlie the caudal truncation. The lack of CYP26 also resulted in homeotic transformation of vertebrae as well as in misspecification of the rostral hindbrain associated with anterior expansion of RA-positive domains. These results suggest that local degradation of RA by CYP26 is required for establishing an uneven distribution of RA along the anterio-posterior axis, which is essential for patterning the hindbrain, vertebrae, and tailbud.


Figures

Figure 1
Figure 1
Generation of CYP26 mutant mice. (A) Targeting strategy. Homologous recombination between the wild-type CYP26 allele (exons are shown as solid boxes) and the targeting vector generates an insertional allele (CYP26neo). A null allele (CYP26) was created by subsequent Cre-mediated deletion of the indicated region located between lox P sites. (C) ClaI; (N) NsiI; (RV) EcoRV; (S) SalI; (X) XhoI; (DT) a diphtheria toxin-resistance cassette. (B) Southern blot analysis of offspring obtained from intercrossing of CYP26neo/+ heterozygotes. Genomic DNA were digested with both NsiI and ClaI, and EcoRV, the resulting fragments were subjected to hybridization with the 5′ probe and the 3′ probe indicated in A, respectively. The sizes of hybridizing fragments are indicated in kilobases. (C) PCR analysis with a mixture of the three primers (P1, P2, and P3) shown in A of offspring obtained from intercrossing of CYP26+/− heterozygotes. The sizes of PCR products are shown in base pairs.
Figure 2
Figure 2
Caudal truncation in CYP26 mutant mice. (A) Wild-type (+/+) and CYP26−/− mice at postnatal day (P) 1, with the mutant exhibiting sirenomelia. The levels of the sections shown in F and G are indicated. (B) Ventral view of wild-type and CYP26−/− mice at P1. The mutant exhibits sirenomelia and lacks external genitalia (arrowhead). (C) Lateral view of an E16.5 CYP26−/− embryo completely lacking hind limbs and a tail. (D) Dorsal view of a homozygous mutant embryo at P1 exhibiting spina bifida. (E) Atresia of the gut in a CYP26−/− embryo at P1. (F,G) Histological examination of the abdomen of a CYP26−/− mouse at P1. Horseshoe kidney (arrow) and a fused ureter (asterisk) are apparent in F. The abnormally dilated bladder (asterisk) apparent in G connects to the ureter shown in F. (vb) Vertebra body. (H) CYP26neo/neo and CYP26neo/− mice at 8–10 wk after birth. Various types of kinky tail (arrows) are apparent in the CYP26neo/− animals. Scale bar, 1 mm for C–G.
Figure 3
Figure 3
Correlation between CYP26 expression and the level of endogenous RA in the tailbud. (A–D) Expression of CYP26 in wild-type embryos at E7.75, E8.25, and E9.0, respectively. Expression of the RARE-hsplacZ transgene in wild-type (E–H) and CYP26−/− (I–J) embryos. X-gal staining extends to the caudal end of the mutant embryos. (A) Anterior; (P) posterior; (n) node. The arrowhead (C,G,K) indicates a position of the caudal end and the asterisk (D,H,L) indicates the base of the allantois. Scale bar, 300 μm.
Figure 4
Figure 4
Molecular characterization of caudal truncation in CYP26−/− embryos. (A,B,D,E) Expression of T (Brachyury) in wild-type (A,B) and CYP26−/− (D,E) embryos at E9.0. The expression of T is markedly down-regulated in the tailbud of the mutant embryo (arrow). The arrowheads in D and E indicate bifurcation of the notochord. (C,F) Expression of Wnt3a in wild-type and CYP26−/− embryos, respectively, at E9.0. The expression of Wnt3a is down-regulated in the tailbud of the mutant embryo (arrow). Scale bar, 300 μm for A–F.
Figure 5
Figure 5
Ectopic neural structures in CYP26−/− embryos. (A–G) Expression of Sox2 in wild-type (A,B) and CYP26−/− (C–G) embryos at E9.5. (B,C) Dorsal view of the neural tube. The arrowheads in C indicate irregular folding of the neural tube. (A) Anterior; (P) posterior; (fl) forelimb. (D,E) Formation of multiple neural tubes. The level of the section shown in E is indicated. The arrowheads in E indicate multiple neural tubes. (F,G) Ectopic neural tube formation. The arrows in F indicate ectopic neural tubes in the trunk. The level of the section shown in G is indicated. The arrowhead in G indicates an ectopic neural tube. Scale bar, 1 mm for A–D,F; 200 μm for E,G.
Figure 6
Figure 6
Homeotic transformation of vertebrae. (A–F) Skeletal staining of wild-type (A–C) and CYP26−/− (D–F) mice at P1. (il) Ilium; (fe) femur; (t) tibia; (fi) fibula; (aaa) anterior arch of the atlas; (at) anterior tubercle; (r) rib; (eo) exoccipital bone. The cervical vertebrae (C1*–C7*), thoracic vertebrae (T1*–T13*), and twenty-first vertebra (L1*) of the mutant mice are also indicated. The arrow in E indicates fusion of C1a* and the exoccipital bone. The arrow in F indicates fusion of ribs. (G) Schematic representation of vertebral transformation. Five CYP26−/− mutant mice (1– 5) were analyzed. Scale bar, 1 mm for A–F.
Figure 7
Figure 7
Elevation of RA level and aberrant expression of Hoxb4 in the somites. (A,B) Expression of the RARE-hsplacZ transgene in the wild-type and CYP26−/− embryos at E10.5. The level of X-gal staining in the trunk was elevated in the CYP26−/− embryos for various staining time of 10 min (A) and 40 min (B). (C) Expression of CYP26 in the trunk of the wild-type embryos at E10.5. Arrowheads indicate the somites. (fl) Forelimb. (D,E) Expression of the Hoxb4 in the somites of wild-type (D) and CYP26−/− (E) embryos at E10.5. The arrow in E indicates ectopic expression of Hoxb4 in the fifth somite of the mutant embryo. Scale bar, 1 mm for C–E.
Figure 8
Figure 8
Altered RA level in the developing forelimb. (A–C) Expression of the RARE-hsplacZ transgene in the forelimb bud of the wild-type embryos at 9.5, E10.5, and E12.5, respectively. (D–F), Expression of the RARE-hsplacZ transgene in the forelimb bud of the CYP26−/− embryos. (A) Anterior; (P) posterior; (D) distal. (G,H) Expression of shh in the forelimb bud of the wild-type (G) and CYP26−/− (H) embryos at E10.5. Scale bar, 300 μm.
Figure 9
Figure 9
Rostral hindbrain defects in CYP26−/− embryos. (A,B) Expression of the RARE-hsplacZ transgene in the hindbrain of wild-type (A) and CYP26−/− (B) embryos at E8.25. The arrow indicates the rostral boundary of X-gal staining. (C–F) Expression of Hoxb1 in wild-type (C,E) and CYP26−/− (D,F) embryos at E8.25 (C,D) and E9.5 (E,F). The arrow in F indicates ectopic expression of Hoxb1 in r3* of the mutant embryo. (G–J) Expression of Krox20 in wild-type (G,I) and CYP26−/− (H,J) embryos at E8.25. (K) Schematic representation of the expression domains of RARE-hsplacZ, Hoxb1, and Krox20 at E8.25. (pr) Prospective rhombomere. (L,M) Sagittal sections of the hindbrain of wild-type and CYP26−/− embryos, respectively, at E10.5. Rhombomere segments are referred to as r1 to r5 in the wild-type embryo and as r1* to r5* in the mutant embryo. In the CYP26−/− embryo, cranial neural crest cells (arrow) are located in the region of r2* to r4*. (ov) Otic vesicle. (N,O) Cranial nerves in wild-type and CYP26−/− embryos, respectively, at E10.5. The nerves were detected with an antibody to neurofilaments. (b1) First branchial arch; (V) fifth (trigeminal) ganglia; (VII) seventh (facial) ganglia. Closed black and open black arrowheads in E8.25 embryos indicate the preotic sulcus and otic sulcus, respectively. Closed red and open red arrowheads in E9.5 and E10.5 embryos indicate the r2–r3 (or r2*–r3*) boundary and the r4–r5 (or r4*–r5*) boundary, respectively. Scale bar, 100 μm for A,B,I,J, and L–O; 300 μm for C–H.

Similar articles

Cited by

References

    1. Abu-Abed SS, Beckett BR, Chiba H, Chithalen JV, Jones G, Metzger D, Chambon P, Petkovich M. Mouse P450RAI (CYP26) expression and retinoic acid-inducible retinoic acid metabolism in F9 cells are regulated by retinoic acid receptor γ and retinoid X α. J Biol Chem. 1998;273:2409–2415. - PubMed
    1. Burke AC, Nelson CE, Morgan BA, Tabin C. Hox genes and the evolution of vertebrate axial morphology. Development. 1995;121:333–346. - PubMed
    1. Chen Y, Huang L, Russo AF, Solursh M. Retinoic acid is enriched in Hensen's node and is developmentally regulated in the early chick embryos. Proc Natl Acad Sci. 1992;89:10056–10059. - PMC - PubMed
    1. Conlon RA. Retinoic acid and pattern formation in vertebrates. Trends Genet. 1995;11:314–319. - PubMed
    1. Conlon RA, Rossant J. Exogenous retinoic acid rapidly induced anterior ectopic expression of murine Hox-2 gene in vivo. Development. 1992;116:357–368. - PubMed

Publication types

MeSH terms

LinkOut - more resources