Human cortical muscle coherence is directly related to specific motor parameters
- PMID: 11102492
- PMCID: PMC6773054
- DOI: 10.1523/JNEUROSCI.20-23-08838.2000
Human cortical muscle coherence is directly related to specific motor parameters
Abstract
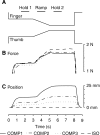
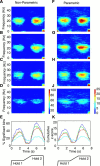
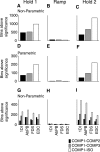
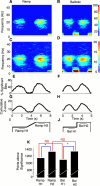
Cortical oscillations have been the target of many recent investigations, because it has been proposed that they could function to solve the "binding" problem. In the motor cortex, oscillatory activity has been reported at a variety of frequencies between approximately 4 and approximately 60 Hz. Previous research has shown that 15-30 Hz oscillatory activity in the primary motor cortex is coherent or phase locked to activity in contralateral hand and forearm muscles during isometric contractions. However, the function of this oscillatory activity remains unclear. Is it simply an epiphenomenon or is it related to specific motor parameters? In this study, we investigated task-dependent modulation in coherence between motor cortex and hand muscles during precision grip tasks. Twelve right-handed subjects used index finger and thumb to grip two levers that were under robotic control. Each lever was fitted with a sensitive force gauge. Subjects received visual feedback of lever force levels and were instructed to keep them within target boxes throughout each trial. Surface EMGs were recorded from four hand and forearm muscles, and magnetoencephalography (MEG) was recorded using a 306 channel neuromagnetometer. All subjects showed significant levels of coherence (0.086-0.599) between MEG and muscle in the 15-30 Hz range. Coherence was significantly smaller when the task was performed under an isometric condition (levers fixed) compared with a compliant condition in which subjects moved the levers against a spring-like load. Furthermore, there was a positive, significant relationship between the level of coherence and the degree of lever compliance. These results argue in favor of coherence between cortex and muscle being related to specific parameters of hand motor function.
Figures


Similar articles
-
Task-dependent modulation of 15-30 Hz coherence between rectified EMGs from human hand and forearm muscles.J Physiol. 1999 Apr 15;516 ( Pt 2)(Pt 2):559-70. doi: 10.1111/j.1469-7793.1999.0559v.x. J Physiol. 1999. PMID: 10087353 Free PMC article. Clinical Trial.
-
Task-dependent modulations of cortical oscillatory activity in human subjects during a bimanual precision grip task.Neuroimage. 2003 Jan;18(1):67-73. doi: 10.1006/nimg.2002.1322. Neuroimage. 2003. PMID: 12507444
-
Modulation of synchrony between single motor units during precision grip tasks in humans.J Physiol. 2002 Jun 15;541(Pt 3):937-48. doi: 10.1113/jphysiol.2001.013305. J Physiol. 2002. PMID: 12068052 Free PMC article. Clinical Trial.
-
The influence of unilateral contraction of hand muscles on the contralateral corticomuscular coherence during bimanual motor tasks.Neuropsychologia. 2016 May;85:199-207. doi: 10.1016/j.neuropsychologia.2016.03.028. Epub 2016 Mar 24. Neuropsychologia. 2016. PMID: 27018484
-
Involvement of the sensorimotor cortex in physiological force and action tremor.Neuroreport. 2001 Jul 3;12(9):1937-41. doi: 10.1097/00001756-200107030-00033. Neuroreport. 2001. PMID: 11435926
Cited by
-
Synchronous EMG activity in the piper frequency band reveals the corticospinal demand of walking tasks.Ann Biomed Eng. 2013 Aug;41(8):1778-86. doi: 10.1007/s10439-013-0832-4. Epub 2013 Jun 6. Ann Biomed Eng. 2013. PMID: 23740367 Free PMC article.
-
Cortical representation of different motor rhythms during bimanual movements.Exp Brain Res. 2012 Dec;223(4):489-504. doi: 10.1007/s00221-012-3276-4. Epub 2012 Sep 25. Exp Brain Res. 2012. PMID: 23007724 Clinical Trial.
-
Changes in corticospinal drive to spinal motoneurones following visuo-motor skill learning in humans.J Physiol. 2006 Jun 15;573(Pt 3):843-55. doi: 10.1113/jphysiol.2006.105361. Epub 2006 Mar 31. J Physiol. 2006. PMID: 16581867 Free PMC article.
-
Actor's and observer's primary motor cortices stabilize similarly after seen or heard motor actions.Proc Natl Acad Sci U S A. 2007 May 22;104(21):9058-62. doi: 10.1073/pnas.0702453104. Epub 2007 Apr 30. Proc Natl Acad Sci U S A. 2007. PMID: 17470782 Free PMC article.
-
Circuits generating corticomuscular coherence investigated using a biophysically based computational model. I. Descending systems.J Neurophysiol. 2009 Jan;101(1):31-41. doi: 10.1152/jn.90362.2008. Epub 2008 Nov 19. J Neurophysiol. 2009. PMID: 19019981 Free PMC article.
References
-
- Adrian ED, Matthews BH. The Berger rhythm: potential changes from the occipital lobes in man. Brain. 1934;57:355–385. - PubMed
-
- Baker SN. “Pooled coherence” can overestimate the significance of coupling in the presence of inter-experiment variability. J Neurosci Methods. 2000;96:171–172. - PubMed
-
- Baker SN, Kilner JM, Pinches EM, Lemon RN. The role of synchrony and oscillations in the motor output. Exp Brain Res. 1999;128:109–117. - PubMed
-
- Bennett KMB, Lemon RN. Corticomotoneuronal contribution to the fractionation of muscle activity during precision grip in the monkey. J Neurophysiol. 1996;75:1826–1842. - PubMed
Publication types
MeSH terms
Grants and funding
LinkOut - more resources
Full Text Sources
