. 2000 Oct 27;103(3):525-35.
doi: 10.1016/s0092-8674(00)00143-4.

Vanilloid receptor-related osmotically activated channel (VR-OAC), a candidate vertebrate osmoreceptor

Affiliations

Vanilloid receptor-related osmotically activated channel (VR-OAC), a candidate vertebrate osmoreceptor

W Liedtke et al. Cell. .

Abstract

The detection of osmotic stimuli is essential for all organisms, yet few osmoreceptive proteins are known, none of them in vertebrates. By employing a candidate-gene approach based on genes encoding members of the TRP superfamily of ion channels, we cloned cDNAs encoding the vanilloid receptor-related osmotically activated channel (VR-OAC) from the rat, mouse, human, and chicken. This novel cation-selective channel is gated by exposure to hypotonicity within the physiological range. In the central nervous system, the channel is expressed in neurons of the circumventricular organs, neurosensory cells responsive to systemic osmotic pressure. The channel also occurs in other neurosensory cells, including inner-ear hair cells, sensory neurons, and Merkel cells.


Figures
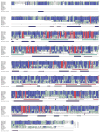
Fig. 1
Fig. 1. Analysis of VR-OAC amino acid sequences
Comparison of the amino acid sequences for VR-OAC from the rat (Rn; 871 amino acids), mouse (Mm; 873 amino acids), human (Hs; 871 amino acids), and chicken (Gg; 852 amino acids) with related proteins, including RnVR1, RnVRL-1, Caenorhabditis elegans (Ce) OSM-9 (GenBank accession number AF031408), and its putative Drosophila melanogaster (Dm) orthologue CG4536 (GenBank accession number AAF46203). Amino acid residues are numbered from the first methionine of RnVR-OAC. The amino and carboxyl termini of RnVR1, RnVRL-1, OSM-9, and CG4536 that do not align with the VR-OACs are omitted. Lower-case letters denote the first and last residues of insertions with respect to the RnVR-OAC sequence. Red columns highlight positions with identical residues over all sequences. Blue columns indicate positions with identical residues within sequence groups (the VR-OACs, RnVR1 and RnVRL-1, and OSM-9 and CG4536). Cyan columns denote conserved positions. The last alignment row shows the consensus sequence. The lower-case characters indicate conservation of chemical classes: o = alcohol, l = aliphatic, a = aromatic, c = charged, h = hydrophobic, p = polar, s = small, u = tiny, and t = turnlike. The percentage of sequence identity of each sequence to the RnVR-OAC sequence is shown at the end of the alignment. Ankyrin-repeat domains (ARD, pale blue boxes), transmembrane regions predicted by PHDhtm (TM, magenta boxes), putative pore-loop regions (PL, gray box), and the secondary structures predicted for RnVR-OAC by PHDsec are indicated. The triangle indicates a putative cAMP-dependent phosphorylation site, open circles denote predicted PKC phosphorylation sites, and filled circles indicate possible asparagine glycosylation sites.
Fig. 2
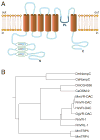
Fig. 2. Schematic structure and phylogenetic relations of VR-OAC
(A) Schematic structure of VR-OAC predicted by hydropathy analysis. Three ankyrin-repeat domains (ARD) occur near the amino terminus. The channel’s core comprises six α-helical transmembrane domains (TM) and a pore loop (PL). (B) The phylogenetic relations among VR-OAC-related proteins, including NOMPC and mammalian TRP proteins. The species abbreviations are provided in the caption of Fig. 1.
Fig. 3
Fig. 3. VR-OAC mRNA expression in rat organs
A multiple-organ Northern blot demonstrates expression of a 3.2-kb VR-OAC mRNA in lung, spleen, kidney, testis, fat, and faintly in trigeminal ganglia. The upper panel shows an autoradiograph of the membrane hybridized with a VR-OAC-specific probe. As an indicator of the relative mRNA loading, the lower panel shows the signal after hybridization to detect the mRNA of glyceraldehyde 3-phosphate dehydrogenase.
Fig. 4
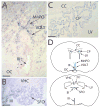
Fig. 4. In situ hybridization analysis of VR-OAC expression in the central nervous system
(A) In a coronal section of the lamina terminalis of the mouse brain, VR-OAC-expressing neurons occur in the arched vascular organ of the lamina terminalis (VOLT). Positive neurons are also located in the median preoptic area (MnPO); a few labeled neurons are scattered through the adjacent brain. The optic chiasm (OC) lies below the third ventricle (III), whose ependymal cells are unlabeled. (B) In another coronal section of the murine lamina terminalis, VR-OAC mRNA is abundantly expressed in neurons of the subfornical organ (SFO). VHC, ventral hippocampal commissure. (C) The ependymal cells of the choroid plexus (CP) of the rat’s lateral ventricle (LV) express VR-OAC mRNA. CC, corpus callosum. (D) Two orientation drawings situate the structures in panels AC in coronal sections of the rodent brain. The abbreviations are as noted for those illustrations. The sections in panels A–C were lightly counterstained with nuclear fast red. The scale bars correspond to 50 μm.
Fig. 5
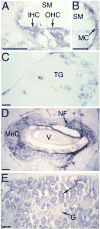
Fig. 5. In situ hybridization analysis of rodent VR-OAC expression
(A) In the murine cochlea, VR-OAC mRNA occurs in both inner hair cells (IHC) and outer hair cells (OHC). SM, scala media. (B) Marginal cells (MC) of the cochlear stria vascularis in the mouse display VR-OAC mRNA. (C) In the murine trigeminal ganglion (TG), VR-OAC mRNA occurs in a population of large neurons. Specific staining is not detectable in small and very large sensory ganglion cells. (D) Surrounding the obliquely sectioned shaft of a vibrissa (V) from an albino rat’s snout, Merkel cells (MeC) strongly express VR-OAC (blue reaction product). Nerve fibers (NF) innervating the Merkel cells are black following anti-neurofilament immunolabeling. (E) In the cortex of the murine kidney, VR-OAC is strongly expressed by epithelial cells of tubules (T). The expression in glomeruli (G) is much weaker. The scale bars correspond to 50 μm.
Fig. 6
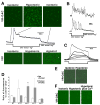
Fig. 6. Gating of VR-OAC investigated by Ca2+ imaging
(A) CHO cells, permanently transfected with an expression vector for chicken VR-OAC and loaded with the Ca2+-indicator fluo-4, are observed by confocal microscopy. Replacement of the isotonic extracellular solution (295 mmol·kg−1) with hypotonic medium (245 mmol·kg−1) results in a dramatic increase in fluorescence, reflecting a rise in the intracellular Ca2+ concentration (upper panels). Replacement of isotonic solution restores the Ca2+ concentration to its background level. In a quantitative analysis of frames from the series, each point represents the fluo-4 fluorescence from a microscopic field containing approximately 2000 cells (plot). The peak fluorescence is 3.8x as great as the control value. Control cells expressing rat VR1 do not exhibit alterations of intracellular Ca2+ concentration when the osmotic strength is changed (lower panels). Exposure to 200 nM of the vanilloid agonist resiniferatoxin increases the intracellular Ca2+ concentration. (B) Individual cells respond to hypotonic solution either by an elevated Ca2+ concentration throughout the stimulus period (upper trace) or by an oscillatory increase (lower trace). The peak fluorescence for each experiment is 5x as great as the respective control value. (C) Cells stably transfected with chicken VR-OAC produce graded responses to a range of hypotonic solutions. The data points represent an exchange from isotonic solution (295 mmol·kg−1) to solutions with osmotic strengths (in mmol·kg−1) of 223 (diamonds), 247 (triangles), 259 (squares), 273 (filled circles), 288 (stars), and 295 (open circles). The stimulus period is indicated below the traces. The peak fluorescence is 4.6x as great as the control value. (D) The temperature sensitivity of cell lines stably transfected with rat or chicken VR-OAC is demonstrated by the fluorescence from roughly 2000 cells stimulated with hypotonic solution of 260 mmol·kg−1. Data are presented as means and standard deviations from 3–4 measurements. For rat VR-OAC, the sensitivity peaks at 37°C, the mammalian core body temperature; for chicken VR-OAC, maximal responsiveness occurs at 40°C, the avian core body temperature. RT, room temperature. (E) In a control experiment, internal Ca2+ stores are depleted with 10 μM thapsigargin and potentiation channels are blocked with 20 μM SKF 96365. Under these conditions, the modest background level of fluo-4 fluorescence does not increase upon exposure to hypotonic medium. (F) When transfected cells in isotonic medium free of Ca2+ are exposed to Ca2+-free hypotonic medium, no change occurs in the intracellular fluo-4 fluorescence. When 2 mM Ca2+ is added to the medium, however, the intracellular Ca2+ concentration promptly rises.
Fig. 7
Fig. 7. Electrophysiological characterization of VR-OAC-expressing CHO cells
(A) Whole-cell current responses to voltage-step stimuli illustrate the osmotic sensitivity and Ca2+-dependent rectification of VR-OAC. The membrane potential was held at 0 mV and stepped in 20-mV increments to ±100 mV (bottom family of traces). Cells exposed to isotonic or hypertonic solutions responded similarly to untransfected control cells. Hypotonic solutions, however, elicited robust whole-cell currents with marked outward rectification in the presence of 1 mM free Ca2+. The rectification developed rapidly and disappeared immediately upon withdrawal of Ca2+. (B) The voltage-current relation under hypotonic conditions displays dual rectification. Inclusion of Ca2+ in the hypotonic medium significantly reduces the inward current. (C) A current record from an inside-out patch at +80 mV shows unitary events corresponding to a conductance of 310 pS. The upper level represents the channel’s open state. Although the results shown were taken from chicken VR-OAC recordings, the electrophysiological responses of the rat orthologue corroborated the principal conclusions.

Similar articles

Cited by

References

    1. Andres KH, von Düring M. Morphology of cutaneous receptors. In: Iggo A, editor. Handbook of Sensory Physiology, Volume II, Somatosensory System. Berlin, Germany: Springer; 1973. pp. 3–28.
    1. Babcock DF, Herrington J, Goodwin PC, Park YB, Hille B. Mitochondrial participation in the intracellular Ca2+ network. J Cell Biol. 1997;136:833–844. - PMC - PubMed
    1. Bisley JW, Rees SM, McKinley MJ, Hards DK, Oldfield BJ. Identification of osmoresponsive neurons in the forebrain of the rat: a Fos study at the ultrastructural level. Brain Res. 1996;720:25–34. - PubMed
    1. Bourque CW, Oliet SH. Osmoreceptors in the central nervous system. Annu Rev Physiol. 1997;59:601–619. - PubMed
    1. Caldwell RA, Clemo HF, Baumgarten CM. Using gadolinium to identify stretch-activated channels: technical considerations. Am J Physiol. 1998;275:C619–C621. - PubMed

Publication types

MeSH terms