Sparing of neuronal function postseizure with gene therapy
- PMID: 11058147
- PMCID: PMC18845
- DOI: 10.1073/pnas.210350097
Sparing of neuronal function postseizure with gene therapy
Erratum in
- Proc Natl Acad Sci U S A 2001 Jan 30;98(3):1317
Abstract
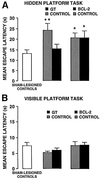
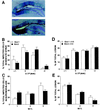
Numerous studies have demonstrated that gene therapy interventions can protect neurons from death after neurological insults. In nearly all such studies, however, "protection" consists of reduced neurotoxicity, with no demonstrated preservation of neuronal function. We used a herpes simplex virus-1 system to overexpress either the Glut-1 glucose transporter (GT) (to buffer energetics), or the apoptosis inhibitor Bcl-2. Both decreased hippocampal neuron loss to similar extents during excitotoxic insults in vitro and in vivo. However, the mediating mechanisms and consequences of the two interventions differed. GT overexpression attenuated early, energy-dependent facets of cell death, blocking oxygen radical accumulation. Bcl-2 expression, in contrast, blocked components of death downstream from the energetic and oxidative facets. Most importantly, GT- but not Bcl-2-mediated protection preserved hippocampal function as assessed spatial maze performance. Thus, gene therapeutic sparing of neurons from insult-induced death does not necessarily translate into sparing of function.
Figures


Similar articles
-
Gene therapies that enhance hippocampal neuron survival after an excitotoxic insult are not equivalent in their ability to maintain synaptic transmission.Exp Neurol. 2000 Nov;166(1):180-9. doi: 10.1006/exnr.2000.7500. Exp Neurol. 2000. PMID: 11031094
-
Limitations in the neuroprotective potential of gene therapy with Bcl-2.Brain Res. 2000 Mar 24;859(2):202-6. doi: 10.1016/s0006-8993(99)02453-1. Brain Res. 2000. PMID: 10719065
-
Neuroprotective effects of bcl-2 overexpression in hippocampal cultures: interactions with pathways of oxidative damage.J Neurochem. 2002 Nov;83(4):914-23. doi: 10.1046/j.1471-4159.2002.01198.x. J Neurochem. 2002. PMID: 12421364
-
Herpes simplex virus vectors overexpressing the glucose transporter gene protect against seizure-induced neuron loss.Proc Natl Acad Sci U S A. 1995 Aug 1;92(16):7247-51. doi: 10.1073/pnas.92.16.7247. Proc Natl Acad Sci U S A. 1995. PMID: 7638175 Free PMC article.
-
Neuroprotective effects of an adenoviral vector expressing the glucose transporter: a detailed description of the mediating cellular events.Brain Res. 2001 Jul 20;908(1):49-57. doi: 10.1016/s0006-8993(01)02572-0. Brain Res. 2001. PMID: 11457430
Cited by
-
Gene therapy using SOD1 protects striatal neurons from experimental stroke.Neurosci Lett. 2007 Jan 3;411(1):32-6. doi: 10.1016/j.neulet.2006.08.089. Epub 2006 Nov 15. Neurosci Lett. 2007. PMID: 17110031 Free PMC article.
-
Cell and gene therapies for refractory epilepsy.Curr Neuropharmacol. 2007;5(2):115-25. doi: 10.2174/157015907780866938. Curr Neuropharmacol. 2007. PMID: 18615179 Free PMC article.
-
Neurocognitive function in bipolar disorder: a comparison between bipolar I and II disorder and matched controls.BMC Psychiatry. 2013 Jun 7;13:165. doi: 10.1186/1471-244X-13-165. BMC Psychiatry. 2013. PMID: 23758923 Free PMC article.
-
Anterograde transport of neurotrophic factors: possible therapeutic implications.Mol Neurobiol. 2004 Apr;29(2):179-96. doi: 10.1385/mn:29:2:179. Mol Neurobiol. 2004. PMID: 15126685 Review.
-
Anti-glucocorticoid gene therapy reverses the impairing effects of elevated corticosterone on spatial memory, hippocampal neuronal excitability, and synaptic plasticity.J Neurosci. 2010 Feb 3;30(5):1712-20. doi: 10.1523/JNEUROSCI.4402-09.2010. J Neurosci. 2010. PMID: 20130180 Free PMC article.
References
Publication types
MeSH terms
Substances
Grants and funding
LinkOut - more resources
Full Text Sources
Medical
Miscellaneous

