. 2000 Oct 2;19(19):5081-91.
doi: 10.1093/emboj/19.19.5081.

Membrane proteins organize a symmetrical virus

Affiliations

Membrane proteins organize a symmetrical virus

K Forsell et al. EMBO J. .

Abstract

Alphaviruses are enveloped icosahedral viruses that mature by budding at the plasma membrane. According to a prevailing model maturation is driven by binding of membrane protein spikes to a preformed nucleocapsid (NC). The T = 4 geometry of the membrane is thought to be imposed by the NC through one-to-one interactions between spike protomers and capsid proteins (CPs). This model is challenged here by a Semliki Forest virus capsid gene mutant. Its CPs cannot assemble into NCs, or its intermediate structures, due to defective CP-CP interactions. Nevertheless, it can use its horizontal spike-spike interactions on membrane surface and vertical spike-CP interactions to make a particle with correct geometry and protein stoichiometry. Thus, our results highlight the direct role of membrane proteins in organizing the icosahedral conformation of alphaviruses.


Figures

None
Fig. 1. The deletion in SFV-CΔ40–118 and expression analysis. (A) Upper and lower panels show functional and structural regions of the capsid gene and CP, respectively. The approximate location of residues with positively charged side chains are indicated (+) in lower panel. The deletion is indicated by grey shading. (B) SDS–PAGE analyses of cell-associated and released viral proteins. Two pairs of cell cultures were transfected with SFV-wt or SFV-CΔ40–118 RNA. The cells were incubated for 6.5 h, pulse-labelled with [35S]methionine for 30 min and then chased for 15 or 180 min. Chase media were collected and cells were lysed with NP-40. Samples of cell lysates (C), pelleted particles from the chase media (P), TCA precipitates of unfractionated media (total, T) and corresponding supernatants (S) were analysed on a 10% gel under reducing conditions. The molecular weight standards (St) were myosin (220 kDa), phosphorylase b (97 kDa), bovine serum albumin (66 kDa), ovalbumin (46 kDa), carbonic anhydrase (30 kDa), trypsin inhibitor (21 kDa) and lysozyme (14 kDa). The figure represents a fluorography of the gel.
None
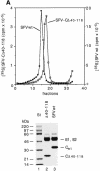
Fig. 2. Purification and composition of CΔ40–118 particles. (A) Sedimentation and protein composition. Four 162 cm2 cell cultures were infected with SFV vectors carrying mutant RNA (m.o.i. = 10) and one with SFV-wt at the same m.o.i. The cultures were labelled with [35S]methionine for 15 h. Particles were collected from the media by pelleting, resuspended and sedimentated in a linear 15–30% (w/w) sucrose gradient run at RCFmax = 150 000 g for 3 h (upper panel). The 35S radioactivity in each fraction was measured. Note that different scales are used for SFV-wt (filled squares, right scale) and SFV-CΔ40–118 (open squares, left scale). Fractions with peak radioactivity were analysed by SDS–PAGE (12%) under reducing conditions (lower panel). (B) RNA composition. Twenty 162 cm2 cell cultures were infected with SFV vectors carrying mutant RNA (m.o.i. = 10) and five cultures with SFV-wt at the same m.o.i. The cultures were labelled with [3H]uridine for 15 h. SFV-wt and SFV-CΔ40–118 particles were then purified by sedimentation in sucrose gradients as described above. A sample of each virus preparation was incubated with SDS and separated on a 15–30% (w/w) sucrose gradient for analyses of 3H-labelled RNA. Fractionation and quantification of radioactivity were as described above. Upper and lower panels show analyses of RNA from the mutant and SFV-wt, respectively. Included in both graphs are analyses of 3H-labelled RNA extracted from SFV-wt infected cells. The latter shows [3H]RNA peaks for the genomic 42S and the subgenomic 26S RNAs. The 3H c.p.m. scale for the control is on the right side in both panels.
None
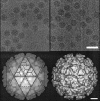
Fig. 3. Reconstructions of wt and mutant particles. Upper panel: cryo-micrographs of vitrified SFV-wt and SFV-CΔ40–118 particles. The images were recorded with an electron dose rate <10 e/Å2/s and at 1 and 3 µm underfocus at the same area (only data set of 3 µm defocus is shown). The average radius of both particles is ∼345 Å. Lower panel: depth-cued and surface-shaded particle reconstructions of SFV-wt (left) and SFV-CΔ40–118 (right). The reconstructions are viewed along an icosahedral 2-fold axis. SFV-wt is overlaid with a T = 4 lattice to illustrate the spike positions relative to 5-, 3- and 2-fold symmetry axes. The facets represent positions of restricted and local 3-fold axes in two icosahedral faces. There are 80 trimeric spikes correspondingly seen in SFV-wt and SFV-CΔ40–118 particles. Enantio morphic information was assigned as described (Cheng et al., 1995).
None
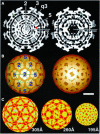
Fig. 4. Comparative imaging of radial density distributions. (A) Equatorial cross-sections of SFV-wt (left) and SFV-CΔ40–118 (right) reconstructions along a 2-fold axis. High densities are white. Symmetry axes are indicated by numbered lines (e.g. ‘3’ and ‘q3’ are icosahedral and quasi 3-fold axes, respectively). The radial axis is marked in Å where the lipid membrane is located between radii 210 and 250 Å. The arrowhead pointed to the radial axis in SFV-wt indicates the NC shell. This supports the NC projections, seen as radially distributed densities between the NC shell and the lipid membrane. (B) Depth-cued representations of SFV-wt and mutant NC. The T = 4 lattice is superimposed on SFV-wt NC to illustrate the organization of the capsomeres. In the mutant, though compact capsomeres with distinct CP projections cannot be distinguished, the nature of T = 4 quasi-equivalence can still be uniquely observed with hexagonal and pentagonal clusters allocated at icosahedral 2-fold and 5-fold axes, respectively. Note that difference imaging with wt NC was carried out, but it gave, apart from the missing shell (seen in A), no additional meaningful information (data not shown). This can be explained by the less ordered positioning of the CΔ40–118 proteins in the mutant particle. Bar = 100 Å. (C) Projected density distributions at specific radii of the mutant to illustrate trimeric spike stems (305 Å) and the juxtaposition of spike protomers (260 Å) and CΔ40–118 proteins (195 Å) at each side of the lipid bilayer. High-to-low densities are indicated with a yellow-to-red scaled colour scheme. (D) One-dimensional density profile of SFV-wt (dotted line) and mutant (continuous line) particles. Major components at each radial bin are indicated for SFV-wt according to results from neutron scattering (Jacrot, 1987). Radial positions of the glycoprotein spikes and the phospholipid headgroups of inner and outer lipid bilayer leaflets agree well between the SFV-wt and the mutant. However, the mutant lacks density corresponding to the NC shell in SFV-wt (indicated by arrowhead).
None
Fig. 5. Stability analysis of the NC in the SFV-CΔ40–118. A sample of 35S-labelled SFV-CΔ40–118 particles, isolated as described in the legend to Figure 2A, was incubated in 1% NP-40 and then analysed by sedimentation in a 15–30% (w/w) sucrose gradient run at RCFmax = 288 000 g for 2 h. Gradient fractions were analysed by SDS–PAGE (12%) under reducing conditions. A sample of 35S-labelled SFV-wt was similarly treated and analysed. The migration of the NC of the SFV-wt is indicated by a bar at the top.
None
Fig. 6. Analysis of cell-associated CΔ40–118 proteins. (A) Sedimentation analysis of large complexes. Cells were transfected with SFV-CΔ40–118 or SFV-wt RNA, pulse-labelled with [35S]methionine for 30 min and chased for 15 min. NP-40 lysates were prepared and analysed in 15–30% (w/w) sucrose gradients run at RCFmax = 288 000 g for 2 h. A sample from each gradient fraction was analysed by SDS–PAGE (10%) under reducing conditions. Results with mutant and SFV-wt are shown in upper and lower panels, respectively. (B) Sedimentation analysis of small complexes. A lysate sample of cells transfected with mutant RNA was analysed in a 5–20% (w/w) sucrose gradient run at RCFmax = 260 000 g for 24 h. Samples from gradient fractions were analysed on a 12% gel under reducing conditions. The sedimentation of several monomeric standard proteins, run under identical conditions, is indicated at the top.
None
Fig. 7. Budding of SFV-wt and SFV-CΔ40–118. Budding of SFV-wt by vertical spike–NC and horizontal spike–spike interactions is shown in the left panel. The right panel shows budding of SFV-CΔ40–118 by horizontal spike–spike interactions only. In the latter case an NC particle cannot be formed and thus, not used as template for spike binding. The role of the CΔ40–118 protein in budding is restricted to triggering the spike to undergo horizontal interactions probably with the help of 26S RNA.

Similar articles

Cited by

References

    1. Acheson N.H. and Tamm,I. (1967) Replication of Semliki Forest virus: an electron microscopic study. Virology, 32, 128–143. - PubMed
    1. Baker T.S. and Cheng,R.H. (1996) A model-based approach for determining orientations of biological macromolecules imaged by cryoelectron microscopy. J. Struct. Biol., 116, 120–130. - PubMed
    1. Brown D. (1980) The togaviruses: biology, structure and replication. In Schlesinger,R.W. (ed.), The Assembly of Alphaviruses. Academic Press, New York, NY, pp. 473–501.
    1. Cheng R.H. (2000) Visualization of virus–host interactions. In Enquist,B., Johnsson,L. and Nieminen,R.M. (eds), Simulation and Visualization on the Grid. Springer-Verlag, New York, NY, pp. 141–154.
    1. Cheng R.H., Olson,N.H. and Baker,T.S. (1992) Cauliflower mosaic virus: A 420 subunit (T = 7) multilayer structure. Virology, 186, 655–668. - PMC - PubMed

Publication types

MeSH terms