. 2000 Oct 1;20(19):7279-89.
doi: 10.1523/JNEUROSCI.20-19-07279.2000.

Changes in expression of two tetrodotoxin-resistant sodium channels and their currents in dorsal root ganglion neurons after sciatic nerve injury but not rhizotomy

Affiliations

Changes in expression of two tetrodotoxin-resistant sodium channels and their currents in dorsal root ganglion neurons after sciatic nerve injury but not rhizotomy

A A Sleeper et al. J Neurosci. .

Abstract

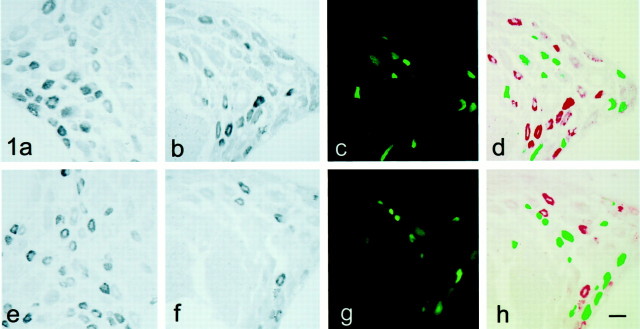
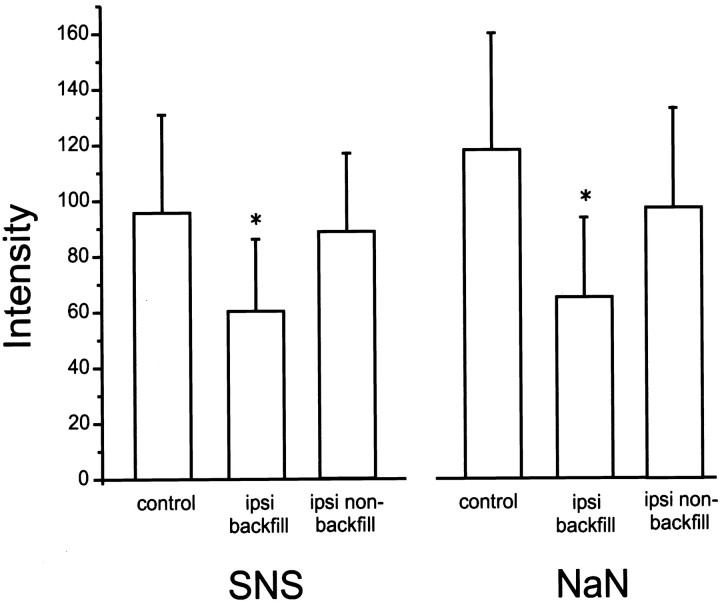
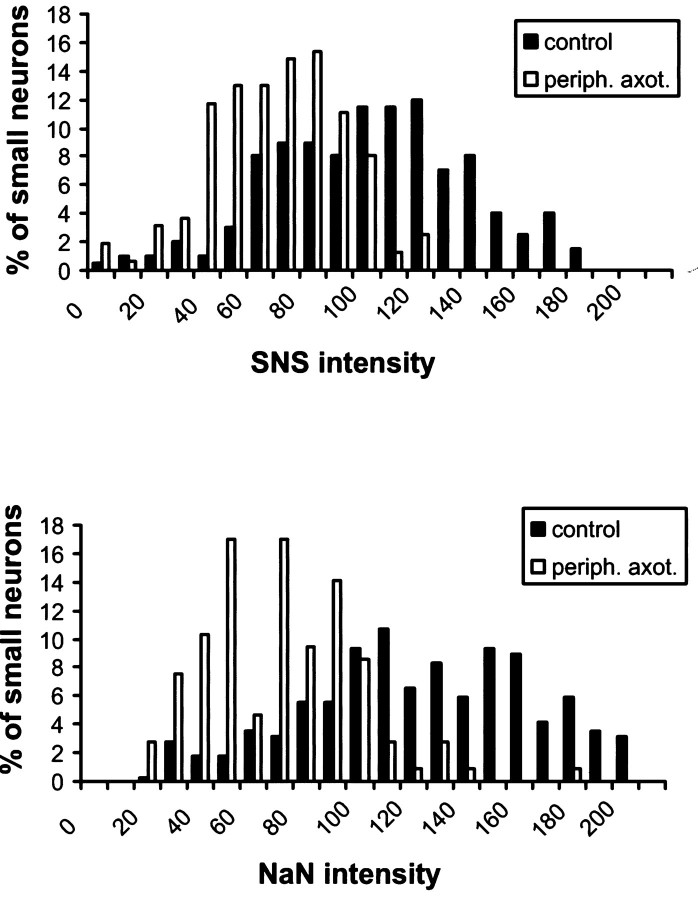
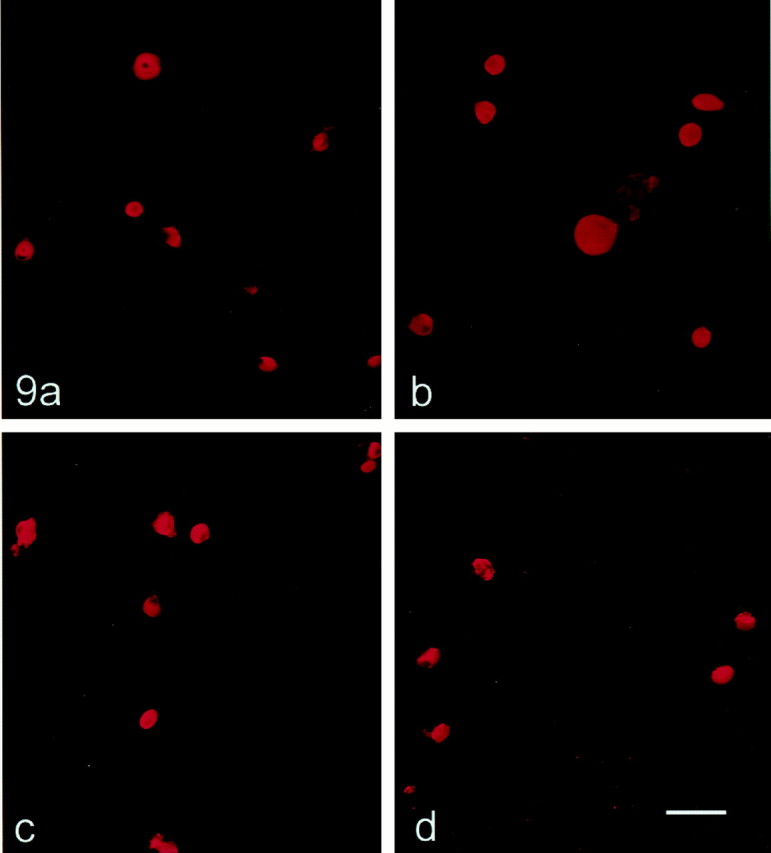
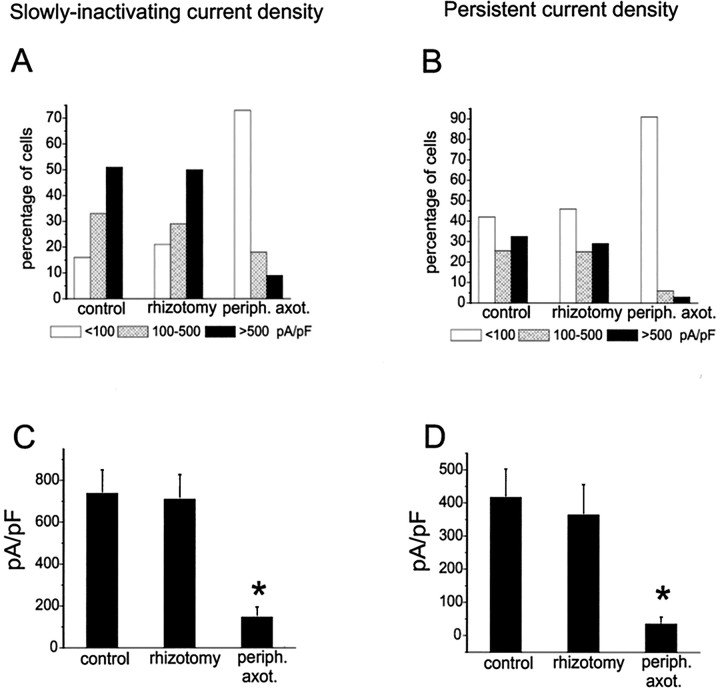
Two TTX-resistant sodium channels, SNS and NaN, are preferentially expressed in c-type dorsal root ganglion (DRG) neurons and have been shown recently to have distinct electrophysiological signatures, SNS producing a slowly inactivating and NaN producing a persistent sodium current with a relatively hyperpolarized voltage-dependence. An attenuation of SNS and NaN transcripts has been demonstrated in small DRG neurons after transection of the sciatic nerve. However, it is not known whether changes in the currents associated with SNS and NaN or in the expression of SNS and NaN channel protein occur after axotomy of the peripheral projections of DRG neurons or whether similar changes occur after transection of the central (dorsal root) projections of DRG neurons. Peripheral and central projections of L4/5 DRG neurons in adult rats were axotomized by transection of the sciatic nerve and the L4 and L5 dorsal roots, respectively. DRG neurons were examined using immunocytochemical and patch-clamp methods 9-12 d after sciatic nerve or dorsal root lesion. Levels of SNS and NaN protein in the two types of injuries were paralleled by their respective TTX-resistant currents. There was a significant decrease in SNS and NaN signal intensity in small DRG neurons after peripheral, but not central, axotomy compared with control neurons. Likewise, there was a significant reduction in slowly inactivating and persistent TTX-resistant currents in these neurons after peripheral, but not central, axotomy compared with control neurons. These results indicate that peripheral, but not central, axotomy results in a reduction in expression of functional SNS and NaN channels in c-type DRG neurons and suggest a basis for the altered electrical properties that are observed after peripheral nerve injury.


Figures

Fig. 1.
Fig. 1.
SNS and NaN mRNA expression in control and peripherally axotomized DRG neurons. Sections of control and peripherally axotomized DRG were processed for nonisotopic in situ hybridization detection of SNS and NaN transcripts. SNS (a) and NaN (e) transcripts are preferentially expressed in small-diameter DRG neurons, although SNS mRNA is also expressed in some larger neurons. Sciatic nerve transection attenuates the number of DRG neurons expressing hybridization signal for SNS (b) or NaN (f). DRG neurons that are transected and retrogradely transport the fluorescent label hydroxystilbamine methanesulfonate fluoresce with a green hue (c, g). Overlay of the images for SNS and NaN hybridization (red) and backfill signals (green) demonstrates that backfilled neurons do not express detectable levels of either SNS (d) or NaN (h) transcripts. Scale bar, 50 μm.
Fig. 2.
Fig. 2.
SNS and NaN protein expression in control and peripherally axotomized DRG neurons. Sections of control and peripherally axotomized DRG were processed for SNS and NaN protein localization using isoform-specific antibodies. SNS (a) and NaN (e) protein are present in small DRG neurons, and SNS is also observed in some larger neurons. Sciatic nerve transection results in a decrease in the number of DRG neurons with detectable levels of SNS (b) or NaN (f) protein. Transected neurons that are backfilled with the retrograde label fluoresce green towhite (c, g). Overlay of images for SNS and NaN localization and backfilled neurons indicates that most backfilled (green) neurons do not possess SNS (d) or NaN (h) immunoreactivity. SNS- and NaN-immunopositive neurons (red) are typically not backfilled, although a small subpopulation (<15%) of backfilled neurons exhibit SNS or NaN (yellow). Scale bar, 50 μm.
Fig. 3.
Fig. 3.
SNS and NaN protein expression in control and peripherally axotomized DRG neurons maintained in culture <24 hr. SNS (a) and NaN (e) protein are present in control DRG neurons. There is an attenuation of SNS (b) and NaN (f) protein in neurons derived from DRG that were peripherally transected 9–12 d before plating. Transected and backfilled neurons are intenselygreen-to-white fluorescent (c, g). Overlay of images for SNS (d) or NaN (h) immunostaining (red) and backfilling demonstrate that most backfilled neurons (green) are not SNS- or NaN-immunopositive. SNS and NaN immunolabeling is clearly present in neurons that are not backfilled. A few neurons are backfilled and maintain SNS or NaN labeling (yellow). There are some neurons that are neither backfilled nor immunolabeled with SNS or NaN (gray neurons). Scale bar, 50 μm.
Fig. 4.
Fig. 4.
Quantification of SNS and NaN signal intensities in control, ipsilateral backfilled (axotomized) and ipsilateral nonbackfilled small DRG neurons. Mean ± SD SNS and NaN fluorescent signals above background level are shown. For both SNS and NaN, there is a significant (p < 0.05) decrease in intensity in ipsilateral backfilled neurons compared with control neurons and also with ipsilateral nonbackfilled neurons. There is a small but not significant decrease in both SNS and NaN intensities in ipsilateral nonbackfilled neurons compared with control neurons.
Fig. 5.
Fig. 5.
Histogram showing distribution of SNS or NaN intensities in small DRG neurons. Data for both control (filled bars) and backfilled, peripherally axotomized (open bars) neurons are shown. Percentage of DRG neurons versus SNS or NaN signal intensity (bin size, 10) is plotted, with results from control and axotomized neurons juxtaposed to comparison. Both SNS and NaN show a shift to lower intensities (to theleft) in peripherally axotomized neurons compared with control neurons. SNS control, n = 205; SNS backfill, n = 162; NaN control,n = 288; NaN backfilled, n = 105.
Fig. 6.
Fig. 6.
In situ hybridization for SNS and NaN transcripts in control and dorsal rhizotomized DRG neurons. Hybridizations signals for SNS are similar between control (a) and rhizotomized (b) DRG. NaN hybridization signal in control (c) and rhizotomized (d) DRG exhibit similar levels. Scale bar, 25 μm.
Fig. 7.
Fig. 7.
Normalized transcript levels of NaN and SNS from DRG after rhizotomy of L4/5 dorsal roots. Transcript levels of NaN and SNS from control and rhizotomized DRG were normalized to the endogenous control 18 S rRNA. Each measurement was done in quadruplet, and the relative amount of target was quantitated by the relative standard curve method. The slight difference in the respective transcript levels of NaN and SNS between control and rhizotomized DRG was not statistically significant. For NaN, normalized transcript levels in control and rhizotomized DRG are 0.35 ± 0.009 and 0.33 ± 0.024, respectively, whereas for SNS, these values are 0.29 ± 0.011 and 0.27 ± 0.008, respectively.
Fig. 8.
Fig. 8.
SNS and NaN protein expression in control and centrally axotomized DRG neurons. Sections of control and centrally axotomized DRG were processed for SNS and NaN protein immunostaining using isoform-specific antibodies. Control (a,c) and centrally axotomized (b,d) DRG sections exhibit similar levels of SNS (a, b) and NaN (c,d) immunolabeling. Scale bar, 50 μm.
Fig. 9.
Fig. 9.
SNS and NaN protein expression in control and centrally axotomized DRG neurons maintained in culture <24 hr. Control (a, c) and centrally axotomized (b, d) DRG neurons show similar levels of SNS (a, b) and NaN (c,d) immunolabeling. Scale bar, 50 μm.
Fig. 10.
Fig. 10.
Quantification of SNS and NaN signal intensities in control and centrally axotomized (rhizotomy) small DRG neurons. Mean ± SD SNS and NaN fluorescent signals above background level are plotted for control and centrally axotomized neurons. Control and rhizotomized DRG neurons exhibit similar mean intensities for SNS and NaN, respectively.
Fig. 11.
Fig. 11.
TTX-resistant sodium currents in small DRG neurons are reduced after peripheral axotomy but not after central rhizotomy. A, TTX-resistant currents recorded from representative control, rhizotomized, and peripheral axotomized neurons with a holding potential of −120 mV. The capacitance of the cells was 23 (control), 25 (rhizotomy), and 28 (peripheral axotomy) pF. The series resistance values were 1.1, 1.3, and 1.5 MΩ, respectively. Calcium currents were blocked with 100 μm cadmium in the bath solution, and TTX (250 nm) blocked the fast-inactivating currents. B, The peak TTX-resistant current amplitude is plotted for the control, rhizotomy, and axotomy groups. Neurons were held at −120 mV and depolarized to voltages ranging from −80 to 40 mV to measure the peak current amplitude.C, The cell capacitance is slightly larger for axotomized neurons. *p < 0.005.
Fig. 12.
Fig. 12.
Rat small DRG neurons express multiple TTX-resistant currents. Slowly inactivating (A) and persistent (B) TTX-resistant currents recorded from representative control, rhizotomized, and peripherally axotomized DRG neurons. Currents were recorded from the same neurons as in Figure 9A. A, Predominantly slowly inactivating currents were recorded if the neurons were held at −60 mV, and a 500 msec step to −120 mV preceded the test pulses. Holding the cells at −60 mV for more than 10 sec induces ultra-slow inactivation of the persistent current (Cummins et al., 1999). The 500 msec prepulse to −120 mV is not long enough to allow recovery of the persistent current from ultra-slow inactivation but is used to allow recovery of slowly inactivating current that inactivated at −60 mV.B, Subtraction of the slowly inactivating component (Fig. 10A) from the total TTX-resistant current (Fig. 9A) reveals the persistent TTX-resistant current.
Fig. 13.
Fig. 13.
Peripheral axotomy, but not dorsal rhizotomy, decreases both slowly inactivating (A) and persistent (B) TTX-resistant sodium current densities in small DRG neurons. The slowly inactivating and persistent TTX-resistant currents were isolated as described in Figure 10. Current densities were estimated by dividing the peak current amplitude by the cell capacitance. Cells were assigned to one of three groups (100, 100–500, or >500 pA/pF) based on current density. The density distribution for the slowly inactivating and the persistent TTX-resistant sodium current are not altered by rhizotomy, but both are dramatically changed, with a reduction in percentage of backfilled cells showing medium or high density, after peripheral axotomy.C, The average peak slowly inactivating TTX-resistant sodium current density is plotted for control, rhizotomy, and peripheral-axotomy groups. D, The average peak persistent TTX-resistant sodium current density is plotted for control, rhizotomy, and peripheral-axotomy groups. *p < 0.005.

Similar articles

Cited by

References

    1. Acheson A, Lindsay RM. Non target-derived roles of the neurotrophins. Philos Trans R Soc Lond B Biol Sci. 1996;351:417–422. - PubMed
    1. Akopian AN, Sivilotti L, Wood JN. A tetrodotoxin-resistant voltage-gated sodium channel expressed by sensory neurons. Science. 1996;379:257–262. - PubMed
    1. Akopian AN, Soulova V, England S, Okuse K, Ogata N, Ure J, Smith A, Kerr BJ, McMahon SB, Boyce S, Hill R, Stanfa LC, Dickenson AH, Wood JN. The tetrodotoxin-resistant sodium channel SNS has a specialized function in pain pathways. Nat Neurosci. 1999;2:541–548. - PubMed
    1. Amaya F, Decosterd I, Samad TA, Plumpton C, Tate S, Mannion RJ, Costigan M, Woolf CJ. Diversity of expression of the sensory neuron-specific TTX-resistant voltage-gated sodium ion channels SNS and SNS2. Mol Cell Neurosci. 2000;15:331–342. - PubMed
    1. Bennett DL, Michael GJ, Ramacharndran N, Munson JB, Averill S, Yan Q, McMahon SB, Priestley JV. A distinct subgroup of small DRG cells express GDNF receptor components and GDNF is protective for these neurons after nerve injury. J Neurosci. 1998;18:3059–3072. - PMC - PubMed

Publication types

MeSH terms

LinkOut - more resources