

Examination of the DNA substrate selectivity of DNA cytosine methyltransferases using mass tagging
- PMID: 10982881
- PMCID: PMC110732
- DOI: 10.1093/nar/28.18.3594
Examination of the DNA substrate selectivity of DNA cytosine methyltransferases using mass tagging
Abstract
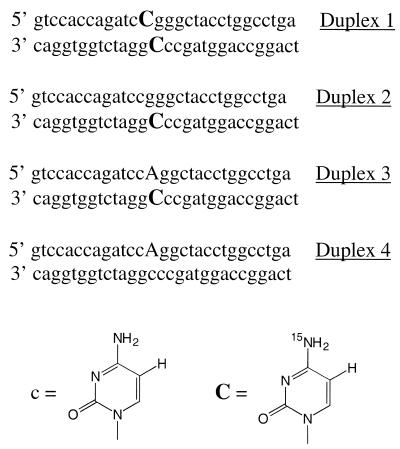
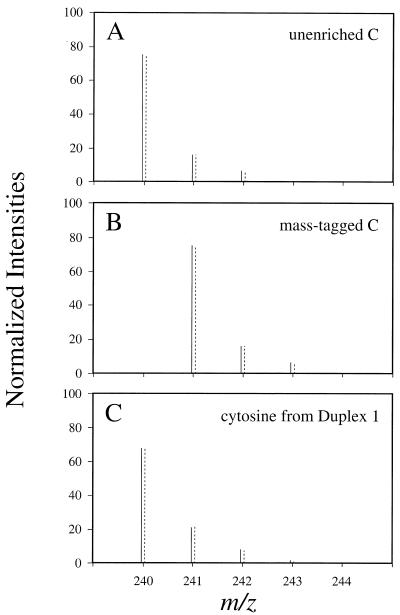
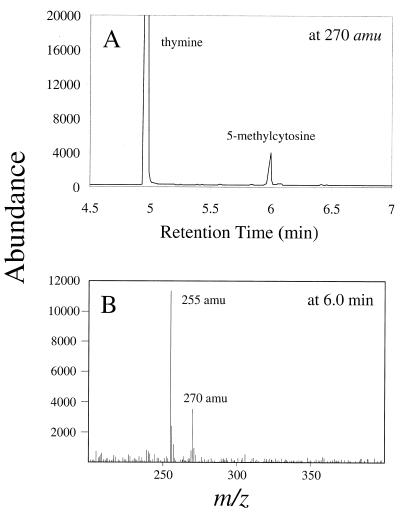
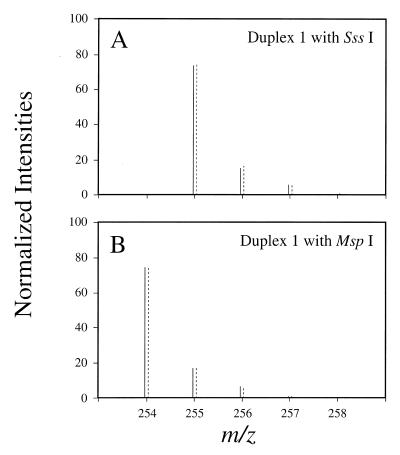
The biological significance of cytosine methylation is as yet incompletely understood, but substantial and growing evidence strongly suggests that perturbation of methylation patterns, resulting from the infidelity of DNA cytosine methyltransferase, is an important component of the development of human cancer. We have developed a novel in vitro assay that allows us to quantitatively determine the DNA substrate preferences of cytosine methylases. This approach, which we call mass tagging, involves the labeling of target cytosine residues in synthetic DNA duplexes with stable isotopes, such as (15)N. Methylation is then measured by the formation of 5-methylcytosine (5mC) by gas chromatography/mass spectrometry. The DNA substrate selectivity is determined from the mass spectrum of the product 5mC. With the non-symmetrical duplex DNA substrate examined in this study we find that the bacterial methyltransferase HPA:II (duplex DNA recognition sequence CCGG) methylates the one methylatable cytosine of each strand similarly. Introduction of an A-C mispair at the methylation site shifts methylation exclusively to the mispaired cytosine residue. In direct competition assays with HPA:II methylase we observe that the mispaired substrate is methylated more extensively than the fully complementary, normal substrate, although both have one HPA:II methylation site. Through the use of this approach we will be able to learn more about the mechanisms by which methylation patterns can become altered.
Figures

Similar articles
-
The response of M.HpaII to heteroduplexes.Gene. 1994 Dec 2;150(1):195-6. doi: 10.1016/0378-1119(94)90884-2. Gene. 1994. PMID: 7959052
-
Overproduction of DNA cytosine methyltransferases causes methylation and C --> T mutations at non-canonical sites.J Biol Chem. 1996 Mar 29;271(13):7851-9. doi: 10.1074/jbc.271.13.7851. J Biol Chem. 1996. PMID: 8631830
-
The cytosine N4-methyltransferase M.PvuII also modifies adenine residues.Biol Chem. 2001 Apr;382(4):707-10. doi: 10.1515/BC.2001.084. Biol Chem. 2001. PMID: 11405235
-
In vitro methylation of DNA with Hpa II methylase.Nucleic Acids Res. 1981 Feb 11;9(3):633-46. doi: 10.1093/nar/9.3.633. Nucleic Acids Res. 1981. PMID: 7220347 Free PMC article.
-
Structure and function of DNA methyltransferases.Annu Rev Biophys Biomol Struct. 1995;24:293-318. doi: 10.1146/annurev.bb.24.060195.001453. Annu Rev Biophys Biomol Struct. 1995. PMID: 7663118 Review.
Cited by
-
Synthesis of stable-isotope enriched 5-methylpyrimidines and their use as probes of base reactivity in DNA.Nucleic Acids Res. 2002 Sep 15;30(18):4068-74. doi: 10.1093/nar/gkf520. Nucleic Acids Res. 2002. PMID: 12235391 Free PMC article.
-
Measurement of the incorporation and repair of exogenous 5-hydroxymethyl-2'-deoxyuridine in human cells in culture using gas chromatography-negative chemical ionization-mass spectrometry.Chem Res Toxicol. 2007 Dec;20(12):1787-96. doi: 10.1021/tx700221x. Epub 2007 Oct 4. Chem Res Toxicol. 2007. PMID: 17914883 Free PMC article.
-
Highly Iterated Palindromic Sequences (HIPs) and Their Relationship to DNA Methyltransferases.Life (Basel). 2015 Mar 17;5(1):921-48. doi: 10.3390/life5010921. Life (Basel). 2015. PMID: 25789551 Free PMC article.
-
Characterization of synthetic oligonucleotides containing biologically important modified bases by matrix-assisted laser desorption/ionization time-of-flight mass spectrometry.Anal Biochem. 2008 Aug 15;379(2):196-207. doi: 10.1016/j.ab.2008.04.031. Epub 2008 Apr 25. Anal Biochem. 2008. PMID: 18485883 Free PMC article.
-
Enzymatic methylation of DNA in cultured human cells studied by stable isotope incorporation and mass spectrometry.Chem Res Toxicol. 2009 Jun;22(6):1060-8. doi: 10.1021/tx900027w. Chem Res Toxicol. 2009. PMID: 19449810 Free PMC article.
References
-
- Riggs A.D. (1975) Cytogenet. Cell Genet., 14, 9–25. - PubMed
-
- Wu J.C. and Santi,D.V. (1987) J. Biol. Chem., 262, 4778–4786. - PubMed
-
- Laird P.W. and Jaenisch,R. (1994) Hum. Mol. Genet., 3, 1487–1495. - PubMed
-
- Schmutte C. and Jones,P.A. (1998) Biol. Chem., 379, 377–388. - PubMed
-
- Gruenbaum Y., Cedar,H. and Razin,A. (1982) Nature, 295, 620–622. - PubMed
Publication types
MeSH terms
Substances
Grants and funding
LinkOut - more resources
Full Text Sources
Other Literature Sources
Molecular Biology Databases
Miscellaneous
